Kotak Mahindra Bank Limited, AMFI Registered Mutual Fund Distributor , ARN 1390

June, 2025
| ▮ |
Market Summary |
Despite tariff uncertainties, escalating geopolitical tensions, and global slowdown worries, the MSCI World All Country Index reached close to all-time high levels, delivering 7.4% returns in USD terms since April to date. Major economies across the globe continued their fiscal support (except India), along with loose monetary policies, despite inflation pressures in developed markets. From April to date, the Nifty Index and Nifty Mid Cap Index delivered 3.1% and 8.4% returns, respectively, compared to the MSCI Asia-Ex Japan, which delivered 7.8% in USD terms. The RBI surprised the markets with a 50 bps repo rate cut and provided a significant boost with a 100 bps CRR cut starting in September.
Most central banks have shown easing bias in response to slowing economic growth. ECB has cut policy rates by 200 bps, SNB by 100 bps, BOE by 100 bps, RBI by 100 bps and PBOC to the lowest level.
In May, both FPIs and DIIs emerged as net buyers, investing USD 2.3 bn and USD 6.7 bn, respectively. In contrast, promoters offloaded equities worth INR 580 bn (~USD 6.8 bn).
India's real GDP grew by 7.4% in Q4 FY25, beating expectations. With supportive policies, low inflation, and a favourable monsoon, economic growth could potentially surprise on the upside compared to market expectations.
Nifty-50 posted moderate net income growth of 3.7% YoY net income growth in Q4 FY25, while the BSE200 and the KIE coverage universe recorded stronger gains of 9.0% and 8.2% respectively - all exceeding expectations.
Source: Bloomberg
| ▮ |
Outlook & Strategy |
• The Indian equity market is poised to remain resilient in the near term, supported by a surge in government spending, macroeconomic stability, and accommodative monetary policy. While trade frictions and geopolitical tensions may temper risk appetite, easing trade tensions and a softer USD are tailwinds for emerging market equities such as India.
• Mid and small caps may outperform in the short run, supported by better than feared Q4 earnings, a sharp uptick in government capex, record GST collections over Rs. 2 trn for the second time this year, and a favourable monsoon forecast-all of which bode well for corporate profitability and investor sentiment.
• On the fixed income front, despite global inflationary pressures, Indian bond markets remain calm. Strong tax collections and fiscal prudence are anchoring yields, even as the INR faces mild depreciation pressure and forward premiums slide amid a recalibrated Fed outlook.
• Last month, we preferred increasing the portfolio beta and raised our allocation to mid and small caps from 20% to 25%. Our investment committee reaffirms this view.
• We continue to maintain a 20:80 allocation between international and domestic equities. However, our investment committee has been advising trimming exposure to the US market and reallocating it to other markets.
• We remain overweight on the Financials sector, with a preference for NBFCs. We are constructive on a recovery in high-end consumption, while early signs of improvement are emerging in the low-end segment.
• We prefer having investments of up to 5% in gold for its diversification benefits in an uncertain global environment.
Source: Bloomberg
| ▮ |
Bond yields surge in developed markets due to fiscal concerns |
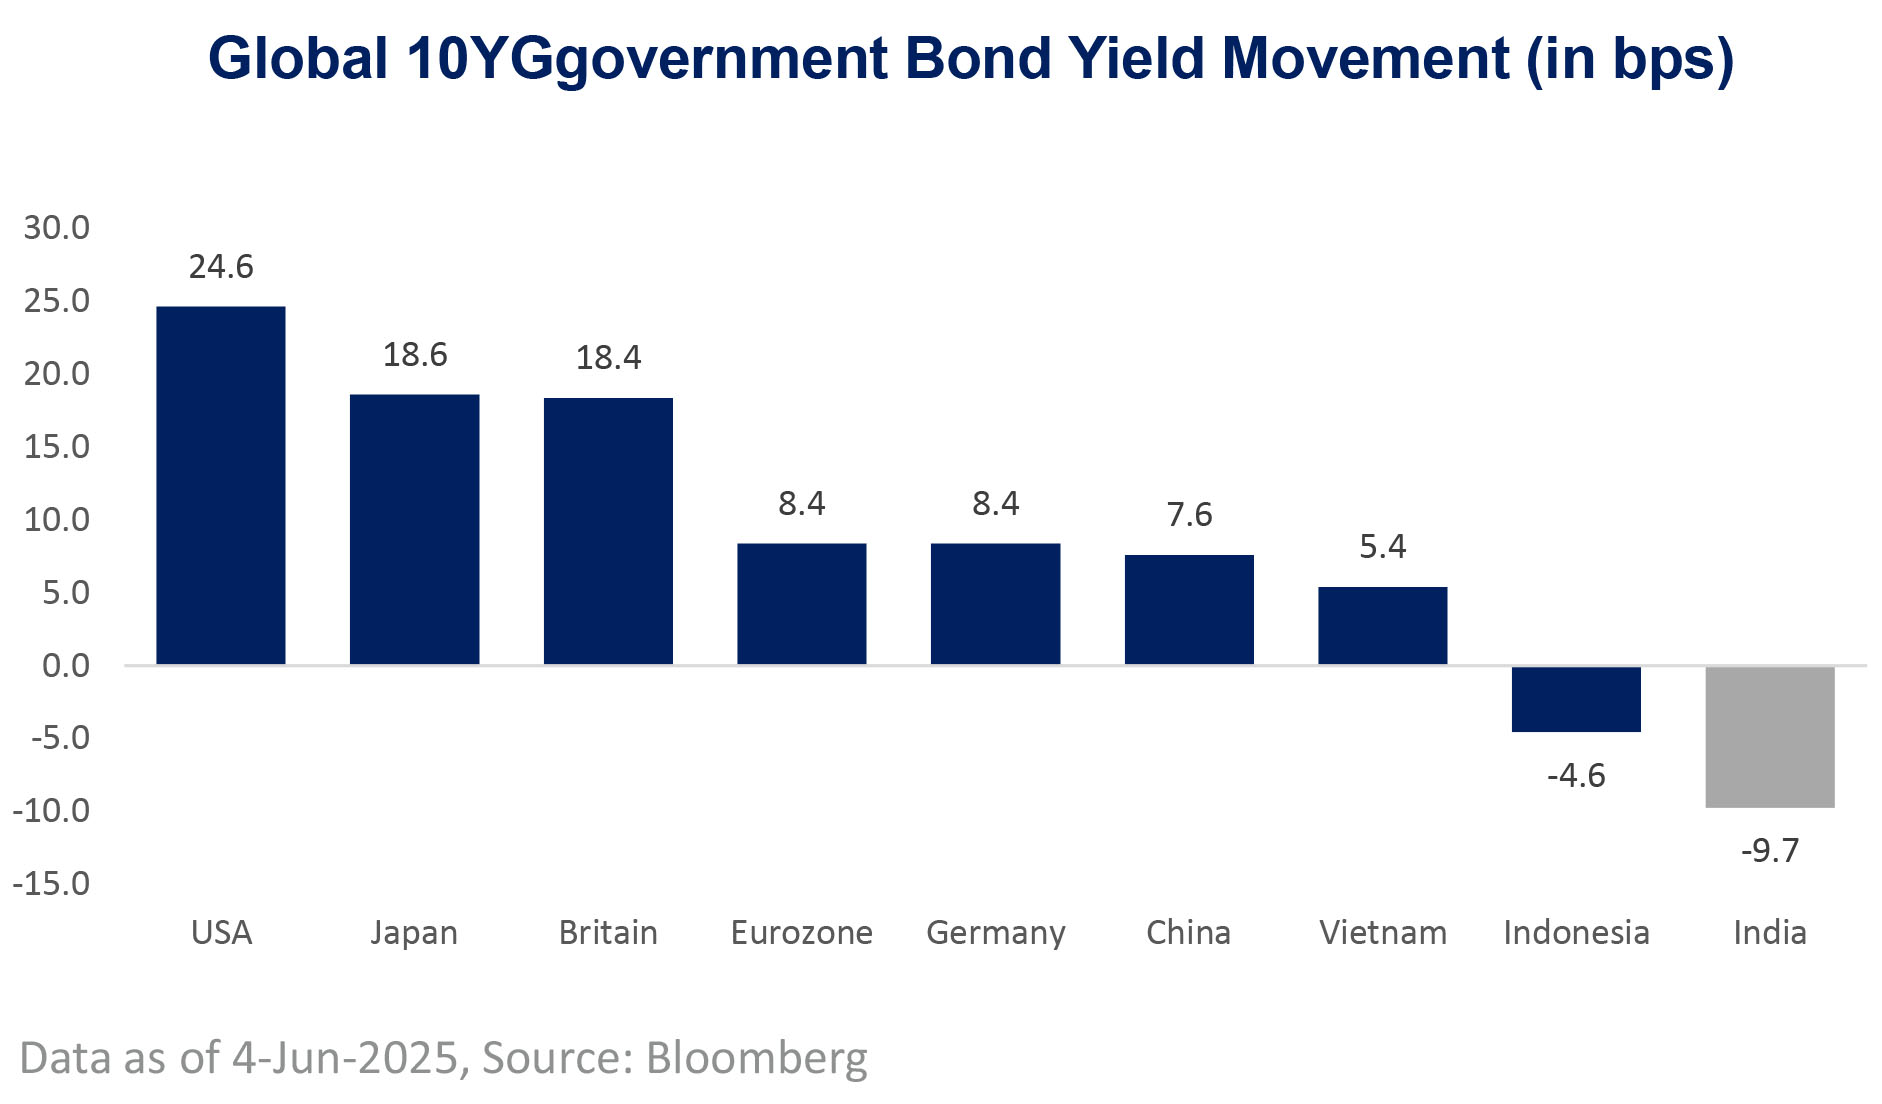
• Bond yields in most developed markets have risen since May. In the US, 10Y bond yields climbed due to fiscal concerns; in Germany, due to fiscal expansion; and in Japan, due to inflationary pressures. In contrast, Indian 10Y bond yields are trending downward, supported by moderating inflation and fiscal discipline
• Bond yields are rising in advanced economies-especially in the US-due to fiscal deterioration, debt concerns and recent credit rating warnings
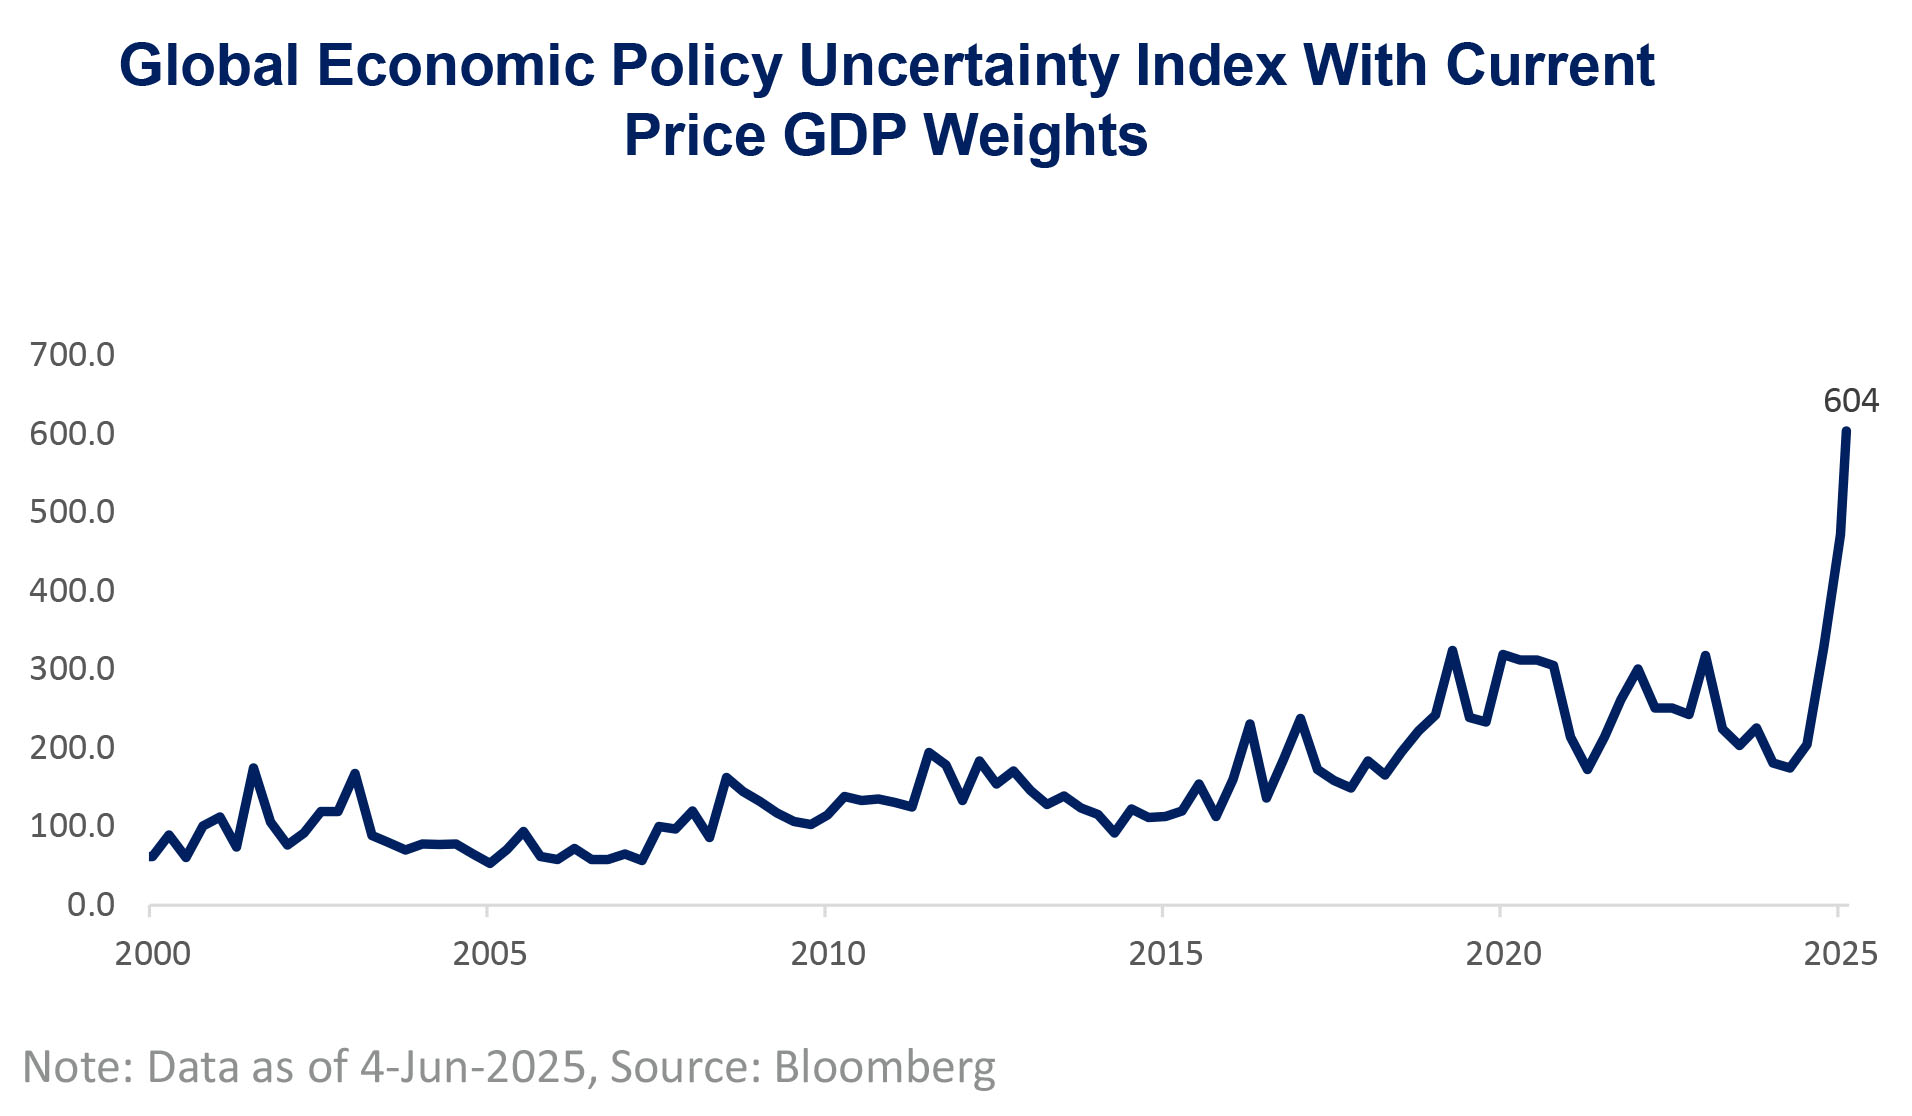
• The global uncertainty index has surged recently; businesses are hesitating to take significant investment decision
| ▮ |
Declining US exceptionalism |
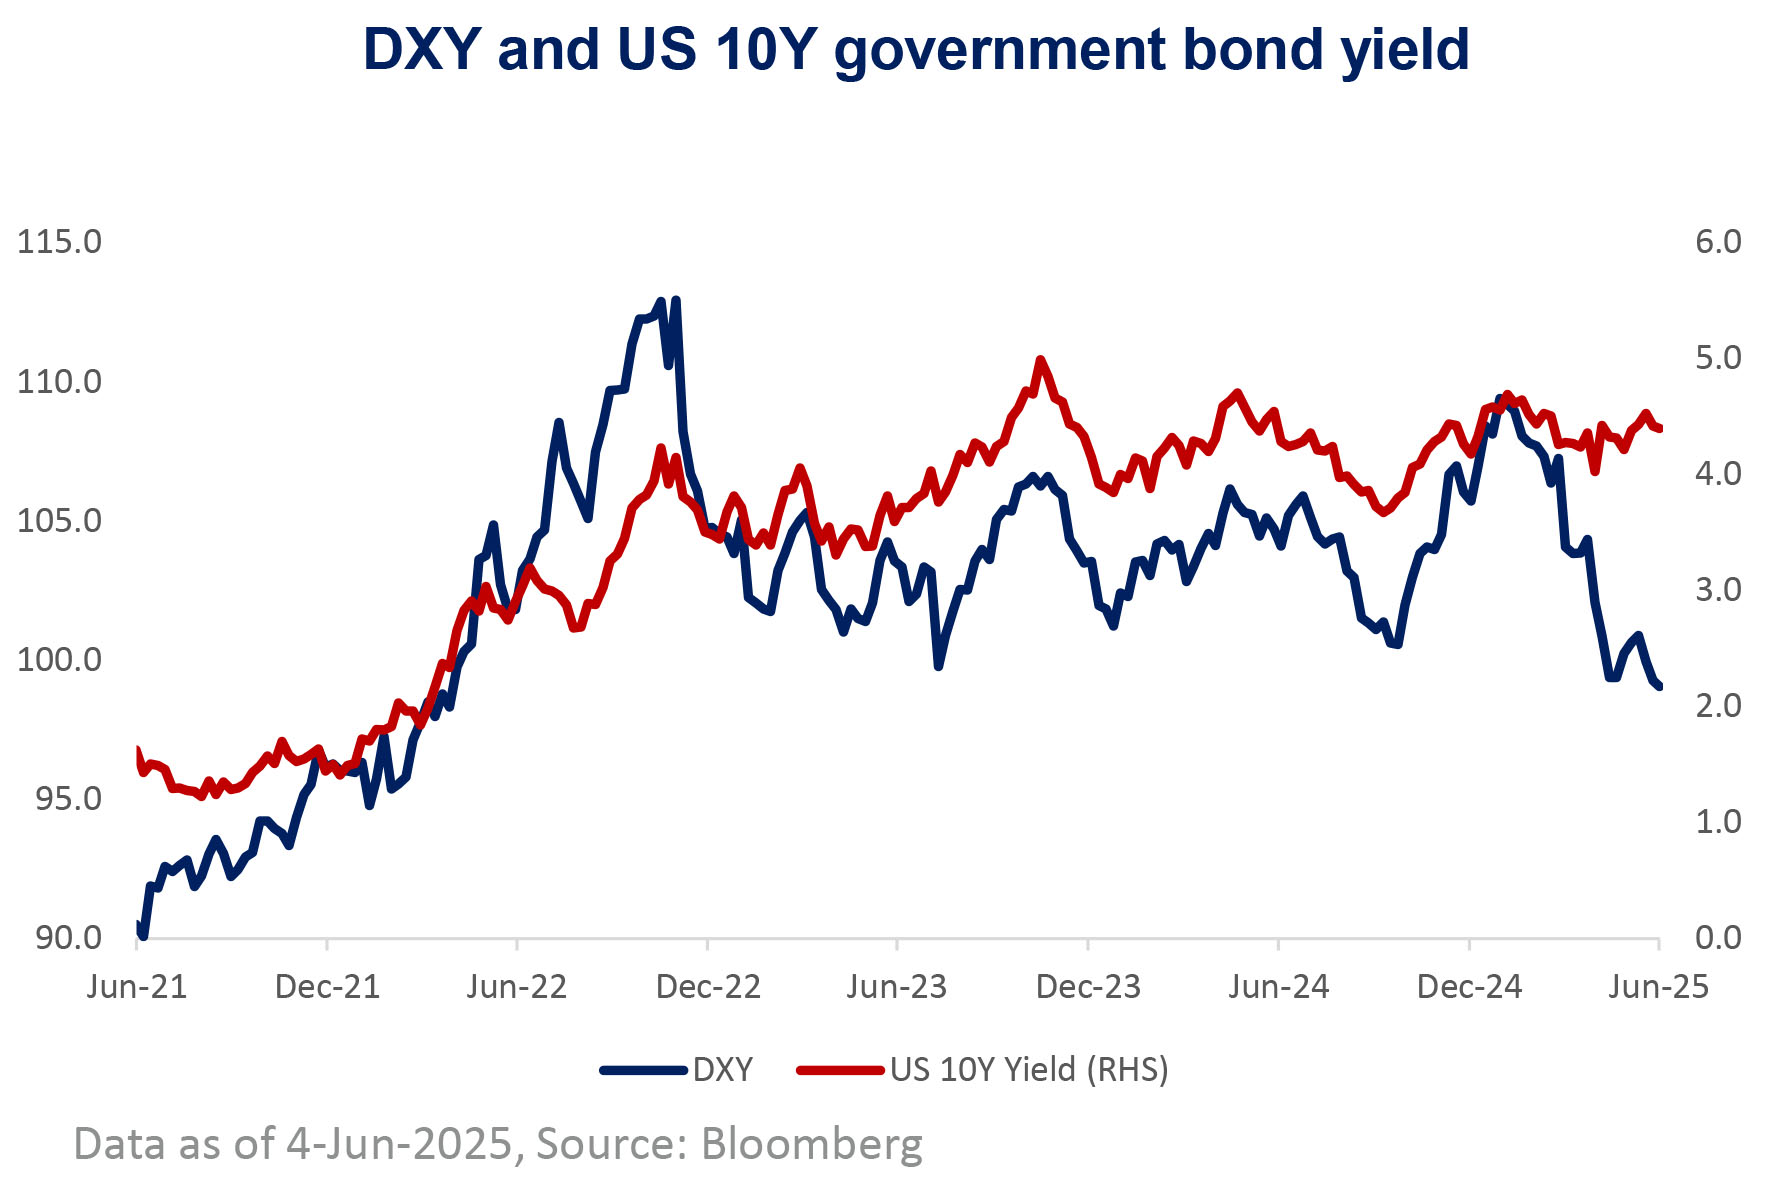
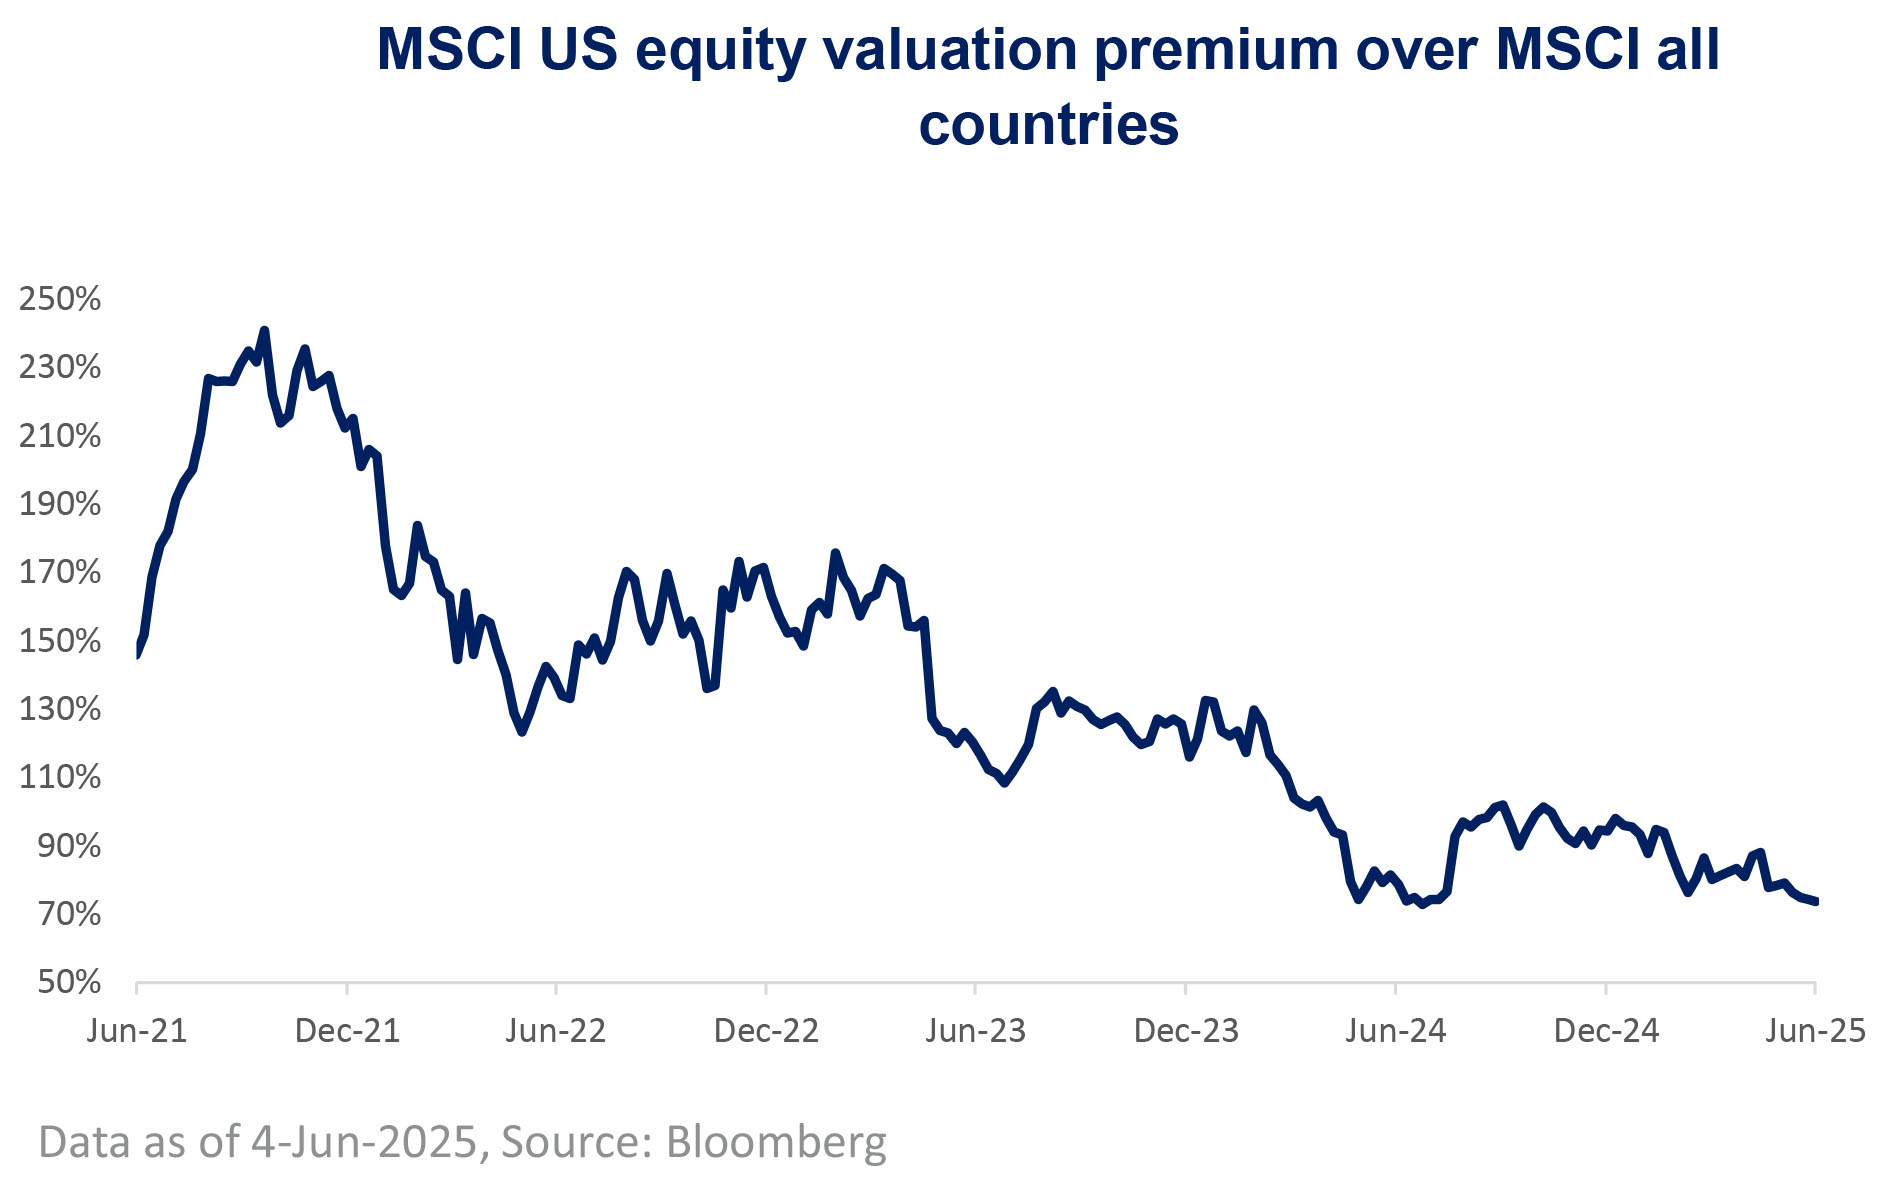
• Despite rising US bond yields, the DXY has declined, reflecting concerns over ballooning fiscal debt. Meanwhile, the valuation premium of US equities over global markets is narrowing - signalling that the US exceptionalism may be fading
• Higher US bond yields and a weaker USD reflect deteriorating US macro fundamentals
• 12mf PE valuation premium of the US equity market continues to decline amid concerns of waning US exceptionalism
| ▮ |
India economy grew at a faster pace |
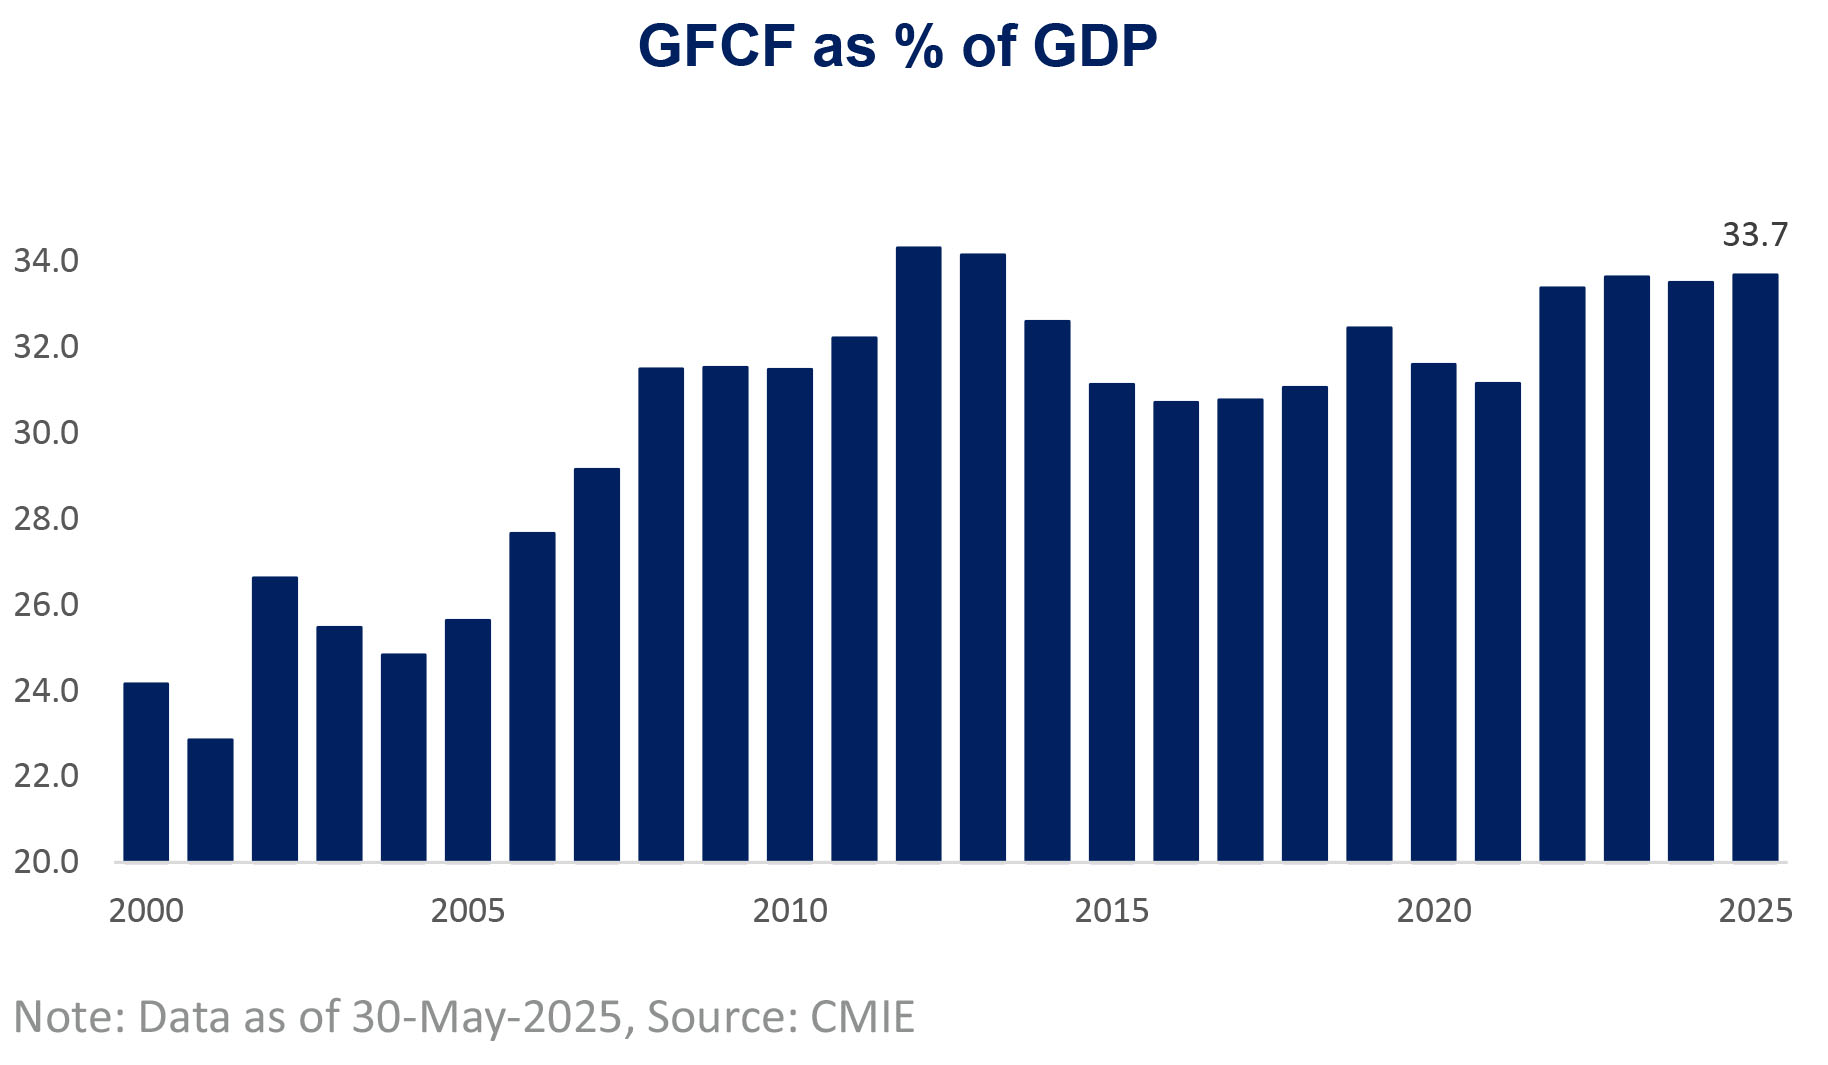
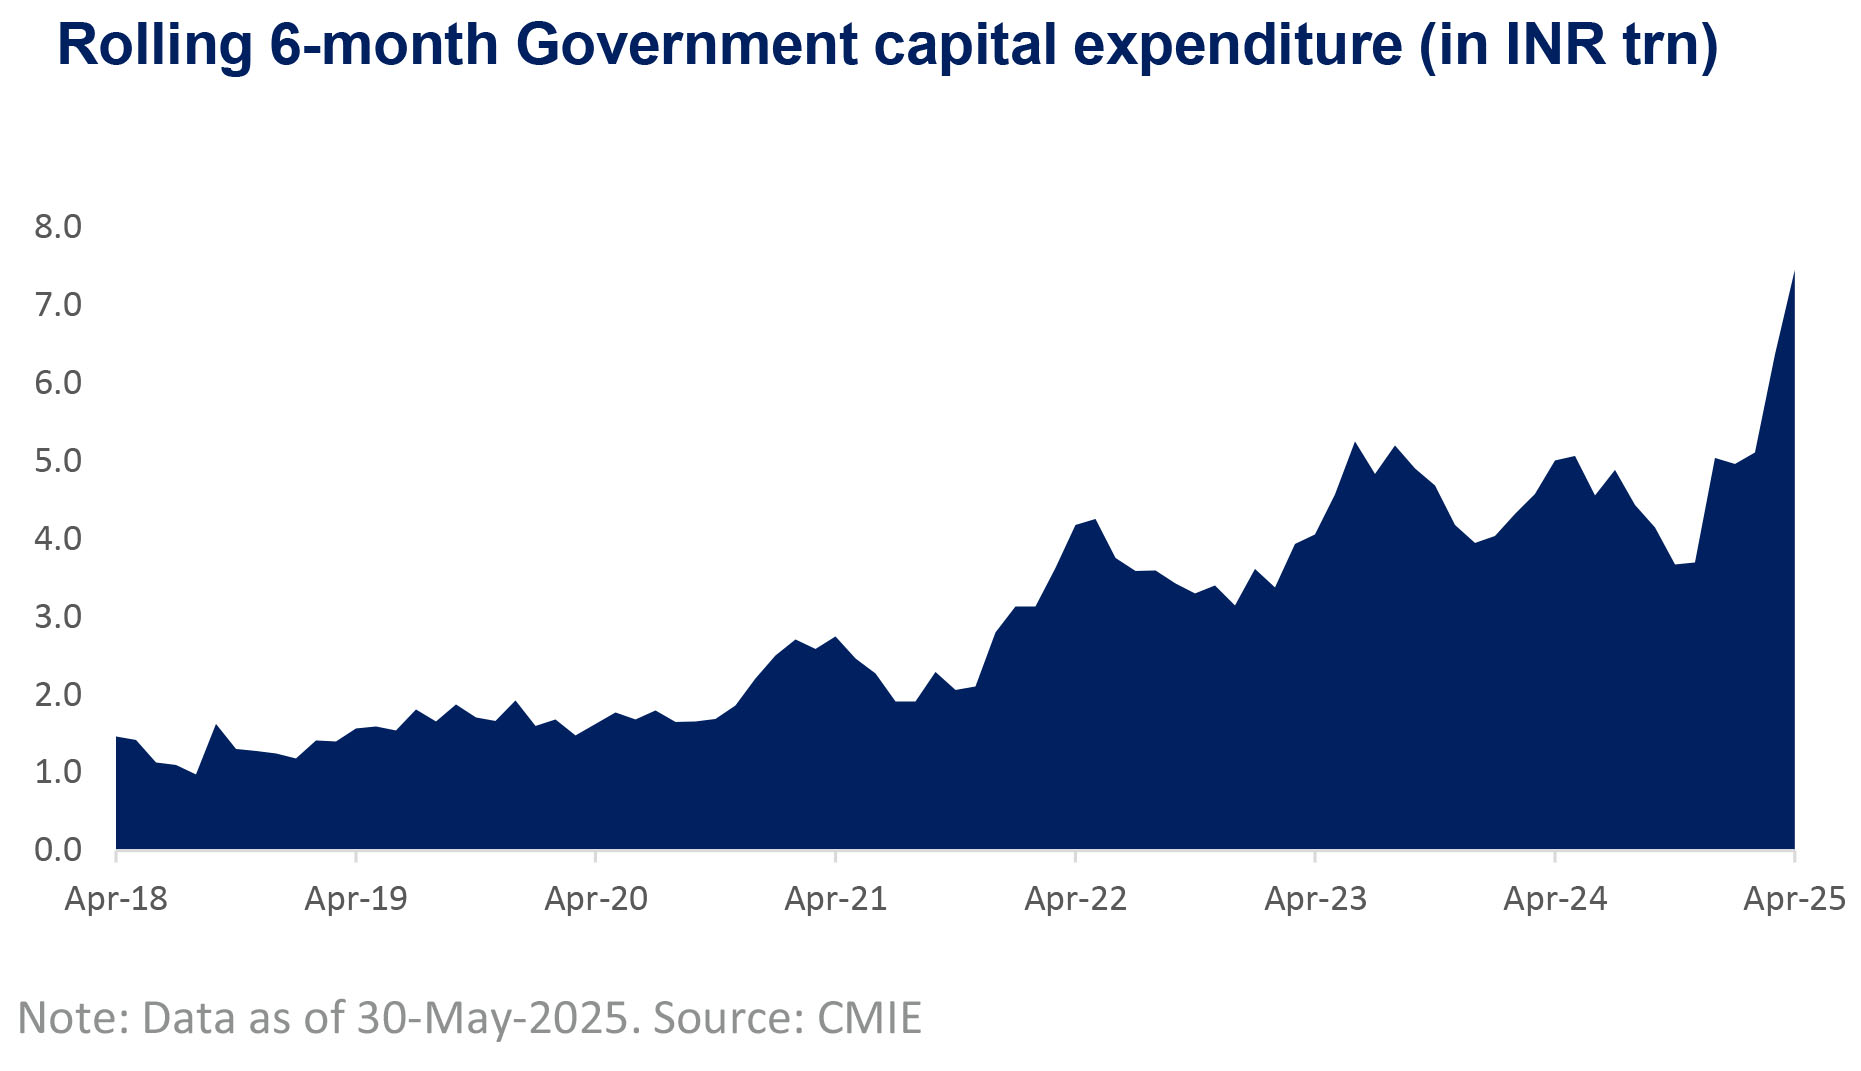
• India's real GDP growth accelerated to 7.4% in Q4FY25 (vs. 6.4% in Q3), beating the consensus estimate of 6.7%. The upside was led by strong Gross Fixed Capital Formation (GFCF), which rose 9.4% YoY and closed FY25 at 33.7% of GDP-the highest since FY13-driven by a recovery in the government capex. The rolling six months government capex at an all-time high. Looking ahead, a combination of above-normal monsoon forecasts, subdued inflation, a likely easing in the monetary cycle, and potential tax-driven consumption support bodes well for sustaining growth momentum into FY26
• GFCF as a % of GDP at the highest levels since FY13 supported by the government capex
• Cumulative government capex over the last six months reached a record Rs. 7.5 trn on a rolling basis
| ▮ |
India's equity valuation re-rates as risk premium falls |
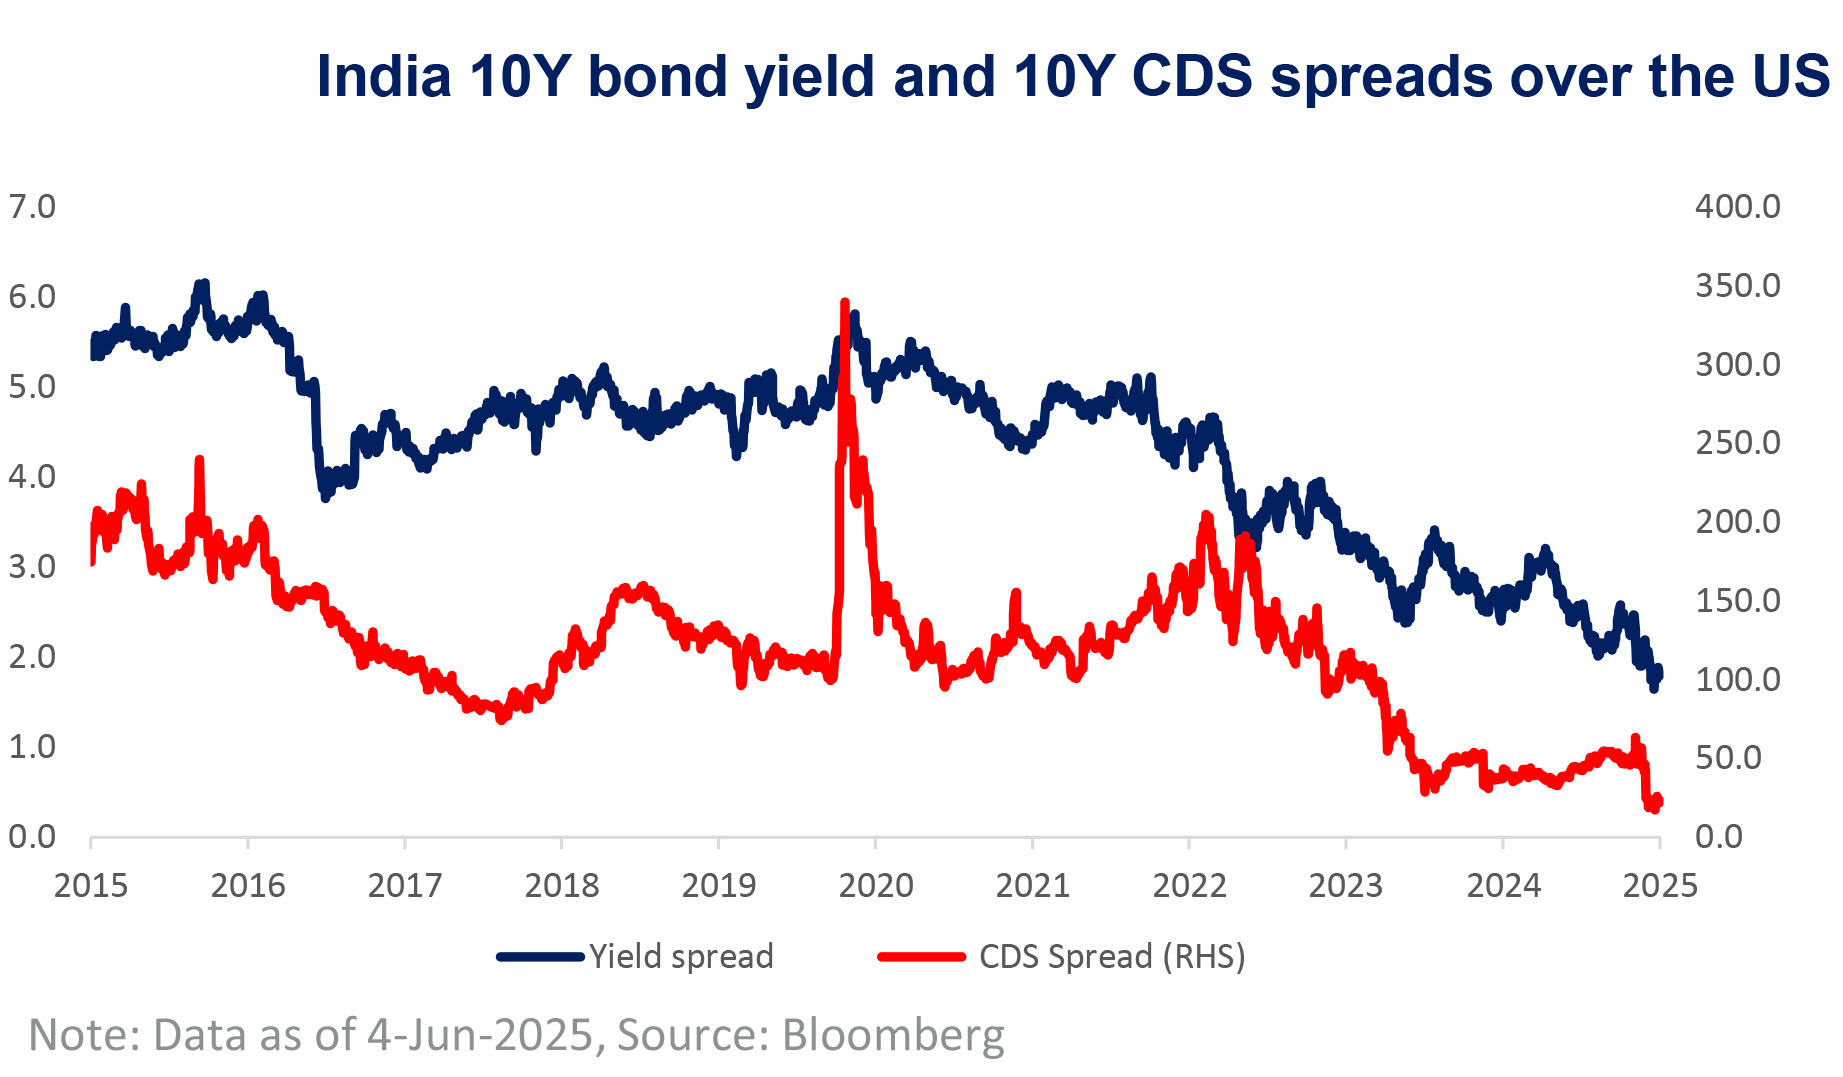
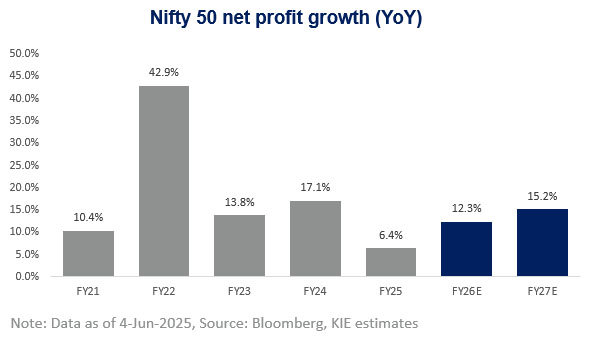
• India's 10Y bond yield and 10Y CDS spreads over the US have declined to multi-year lows, indicating compression in the country's risk premium, underpins the resilience of its valuation premium. While Q4FY25 Nifty earnings growth slowed to 3.7%, it exceeded expectations. With macro tailwinds intact, earnings growth is projected to recover to the low double digit in FY26, following a modest 6.4% rise in FY25
• India relative risk premium versus the US hits multi-years low
• Corporate earnings in India are expected to return to double-digit growth in FY26, following a subdued FY25
| ▮ |
India's bond market stable despite global uncertainties |
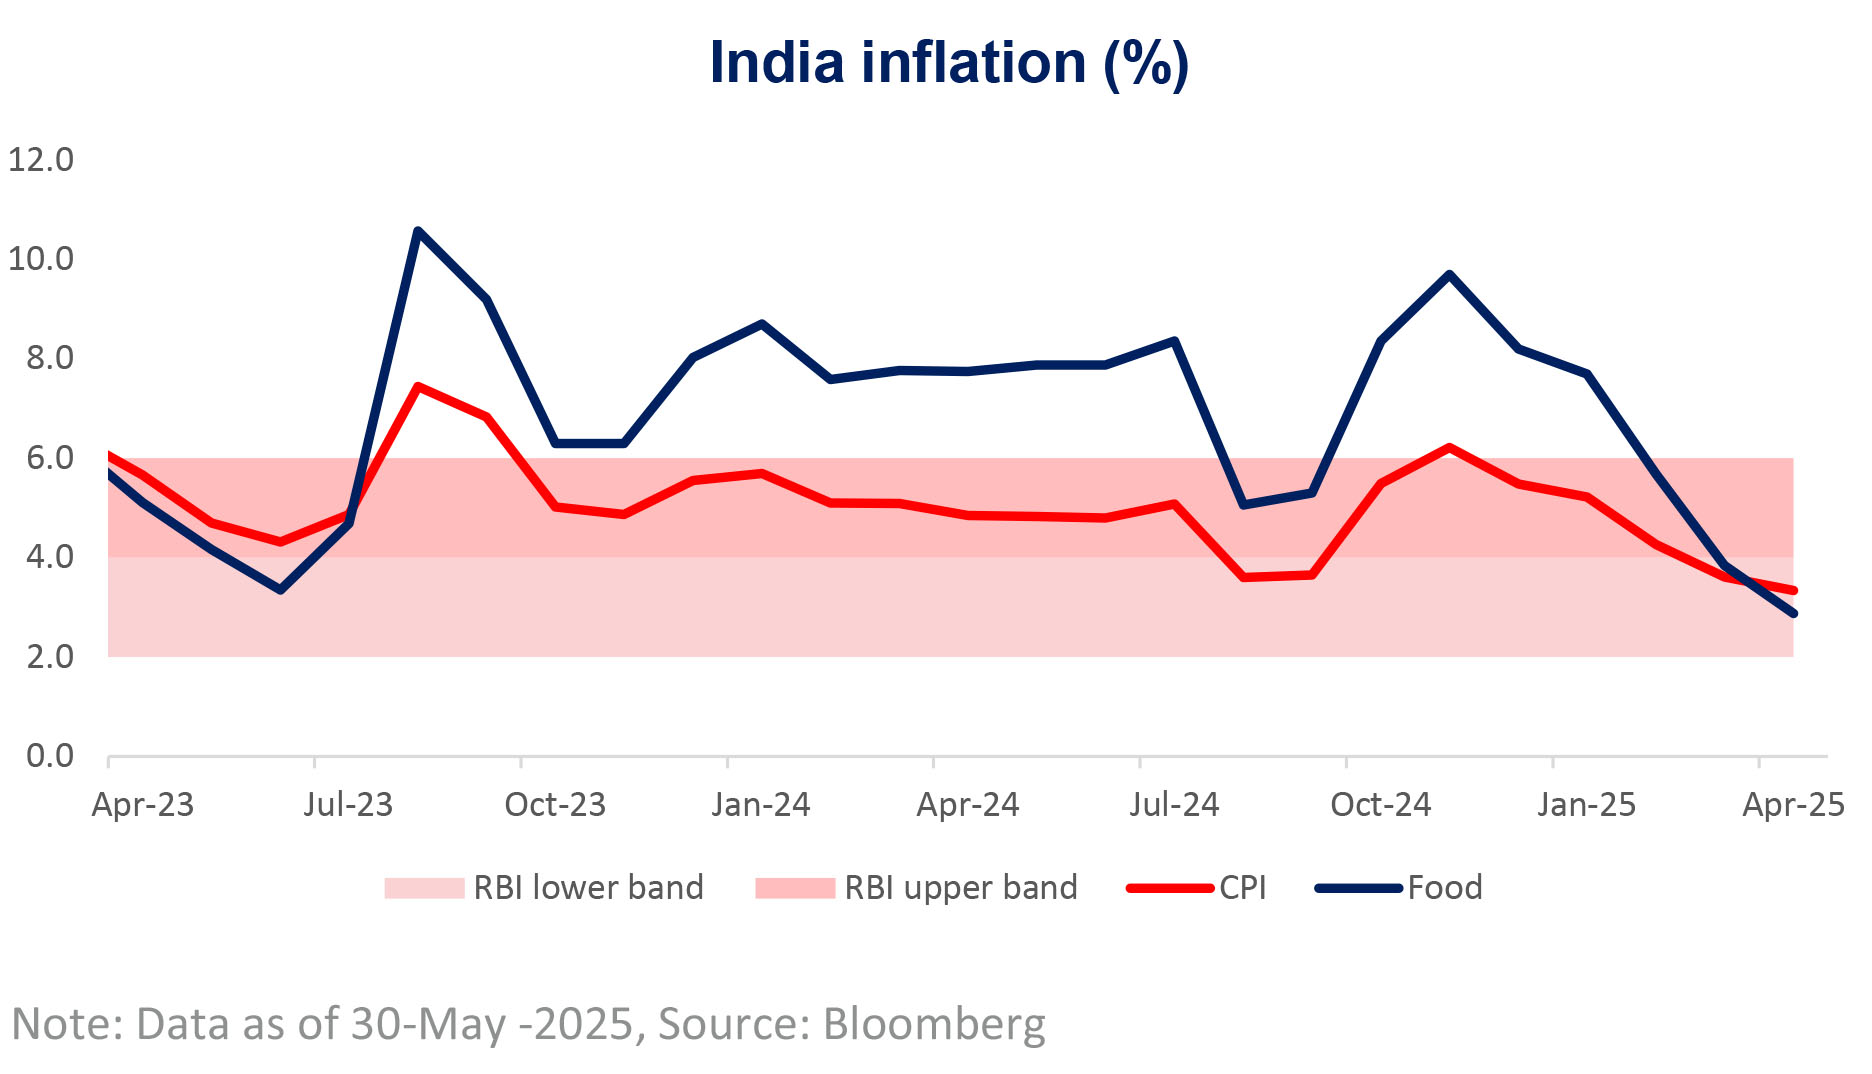
• Despite rising yields in developed markets, India's 10Y bond yield declined 15 bps since May. India's remarkable macro resilience, supported by falling inflationary trends, record RBI dividend and well controlled government borrowing program should help Indian bond yields to remain well anchored with further downward bias, in our view. We expect the RBI to maintain status quo in next two policy meetings, with a possibility another 25 to 50 bp rate cuts by Mar-26
• India's retail inflation eased to a five-year low of 3.2% in April, driven by a sharp drop in food prices
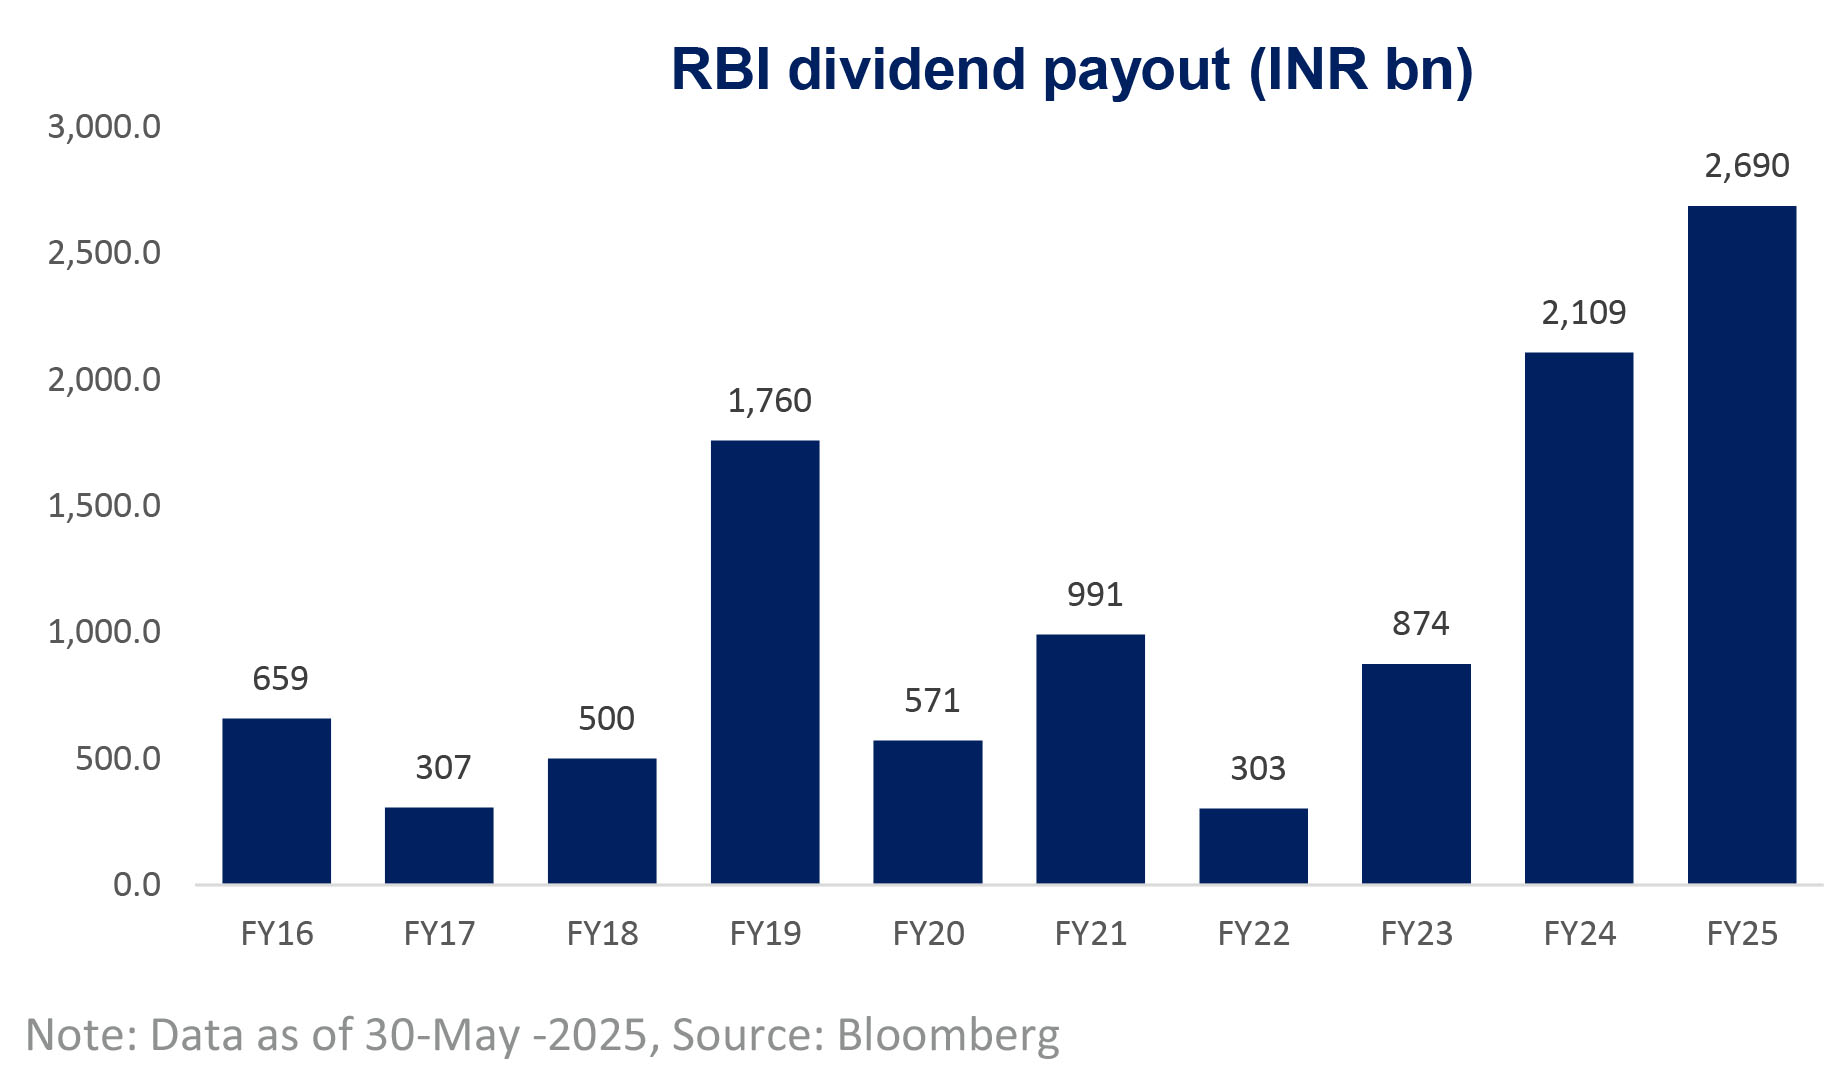
• RBI pays record dividend of INR 2.7 trn in FY25, significantly higher than budgeted estimates of INR 1.0 trn, providing ample fiscal headroom to the Indian government
| ▮ |
USDINR forward premium continues to decline |
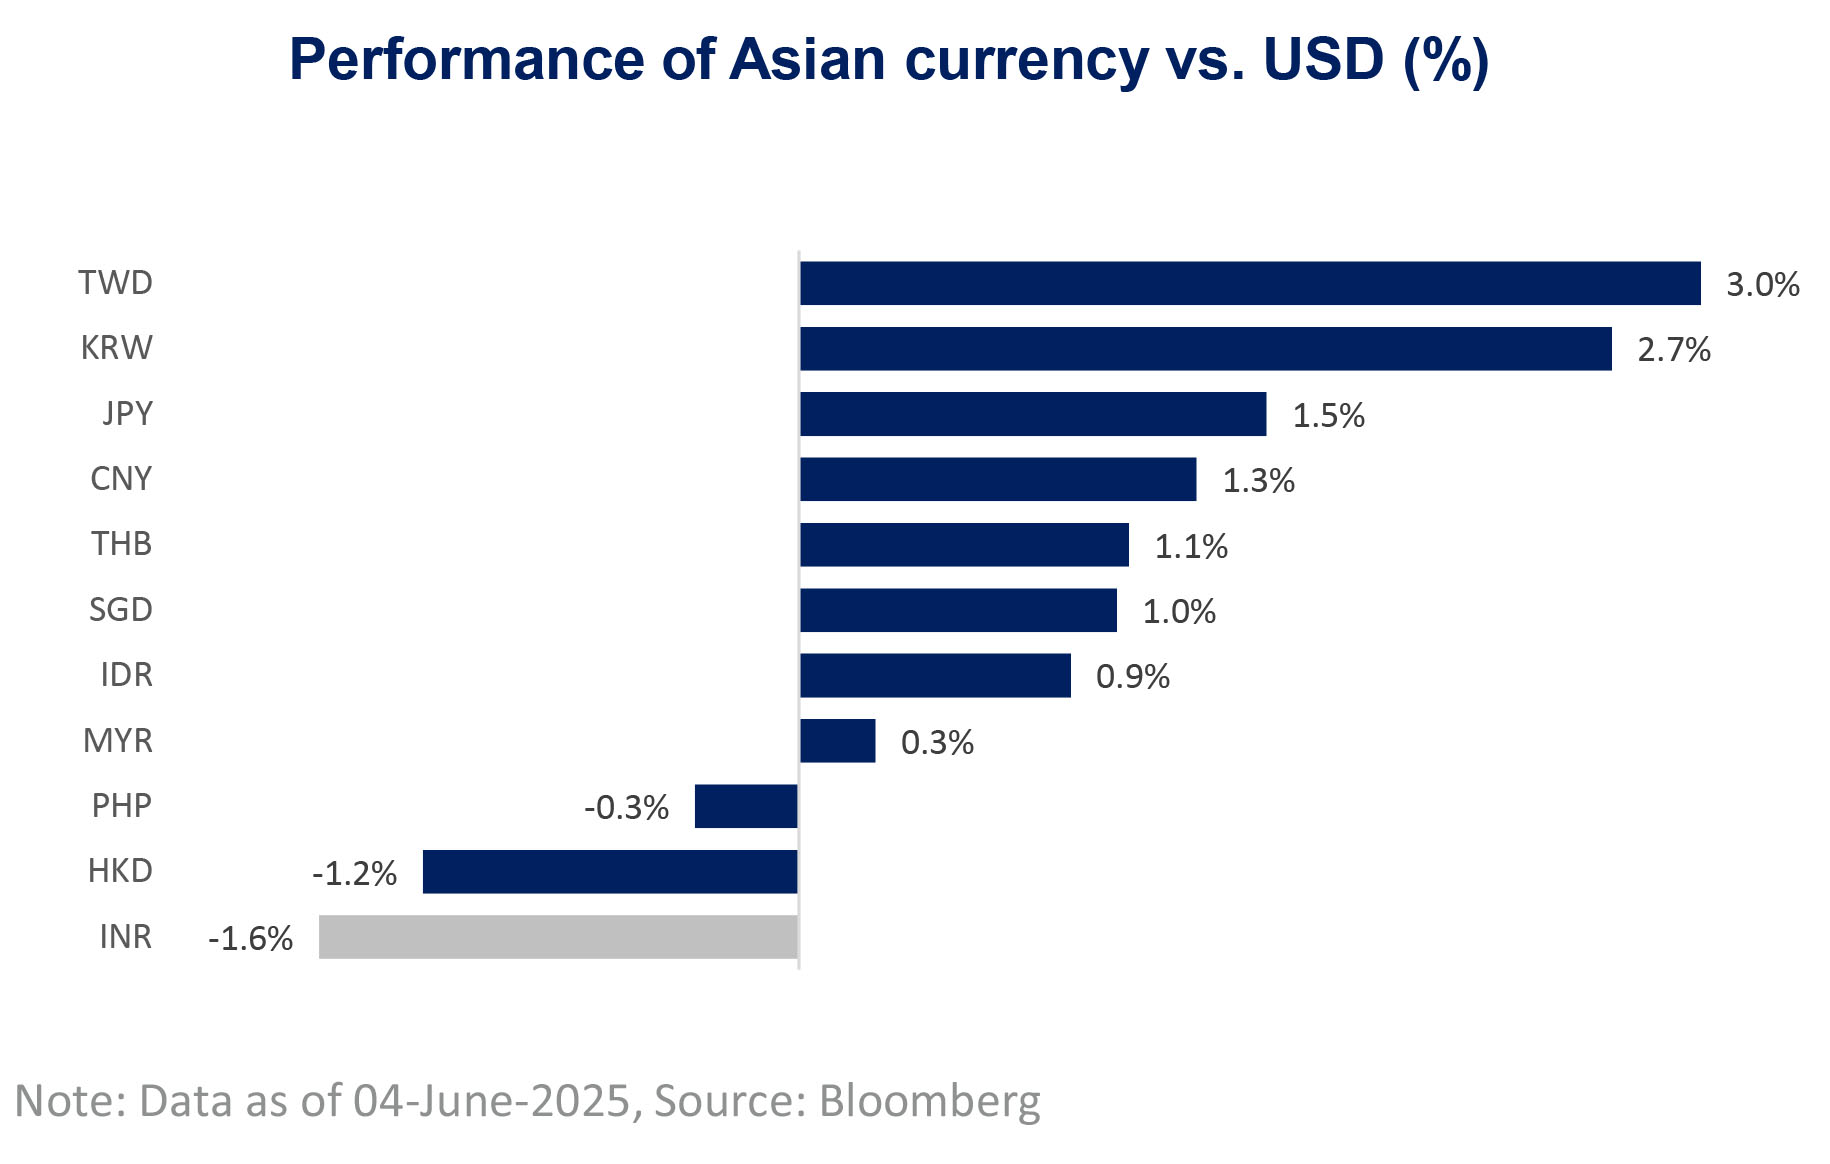
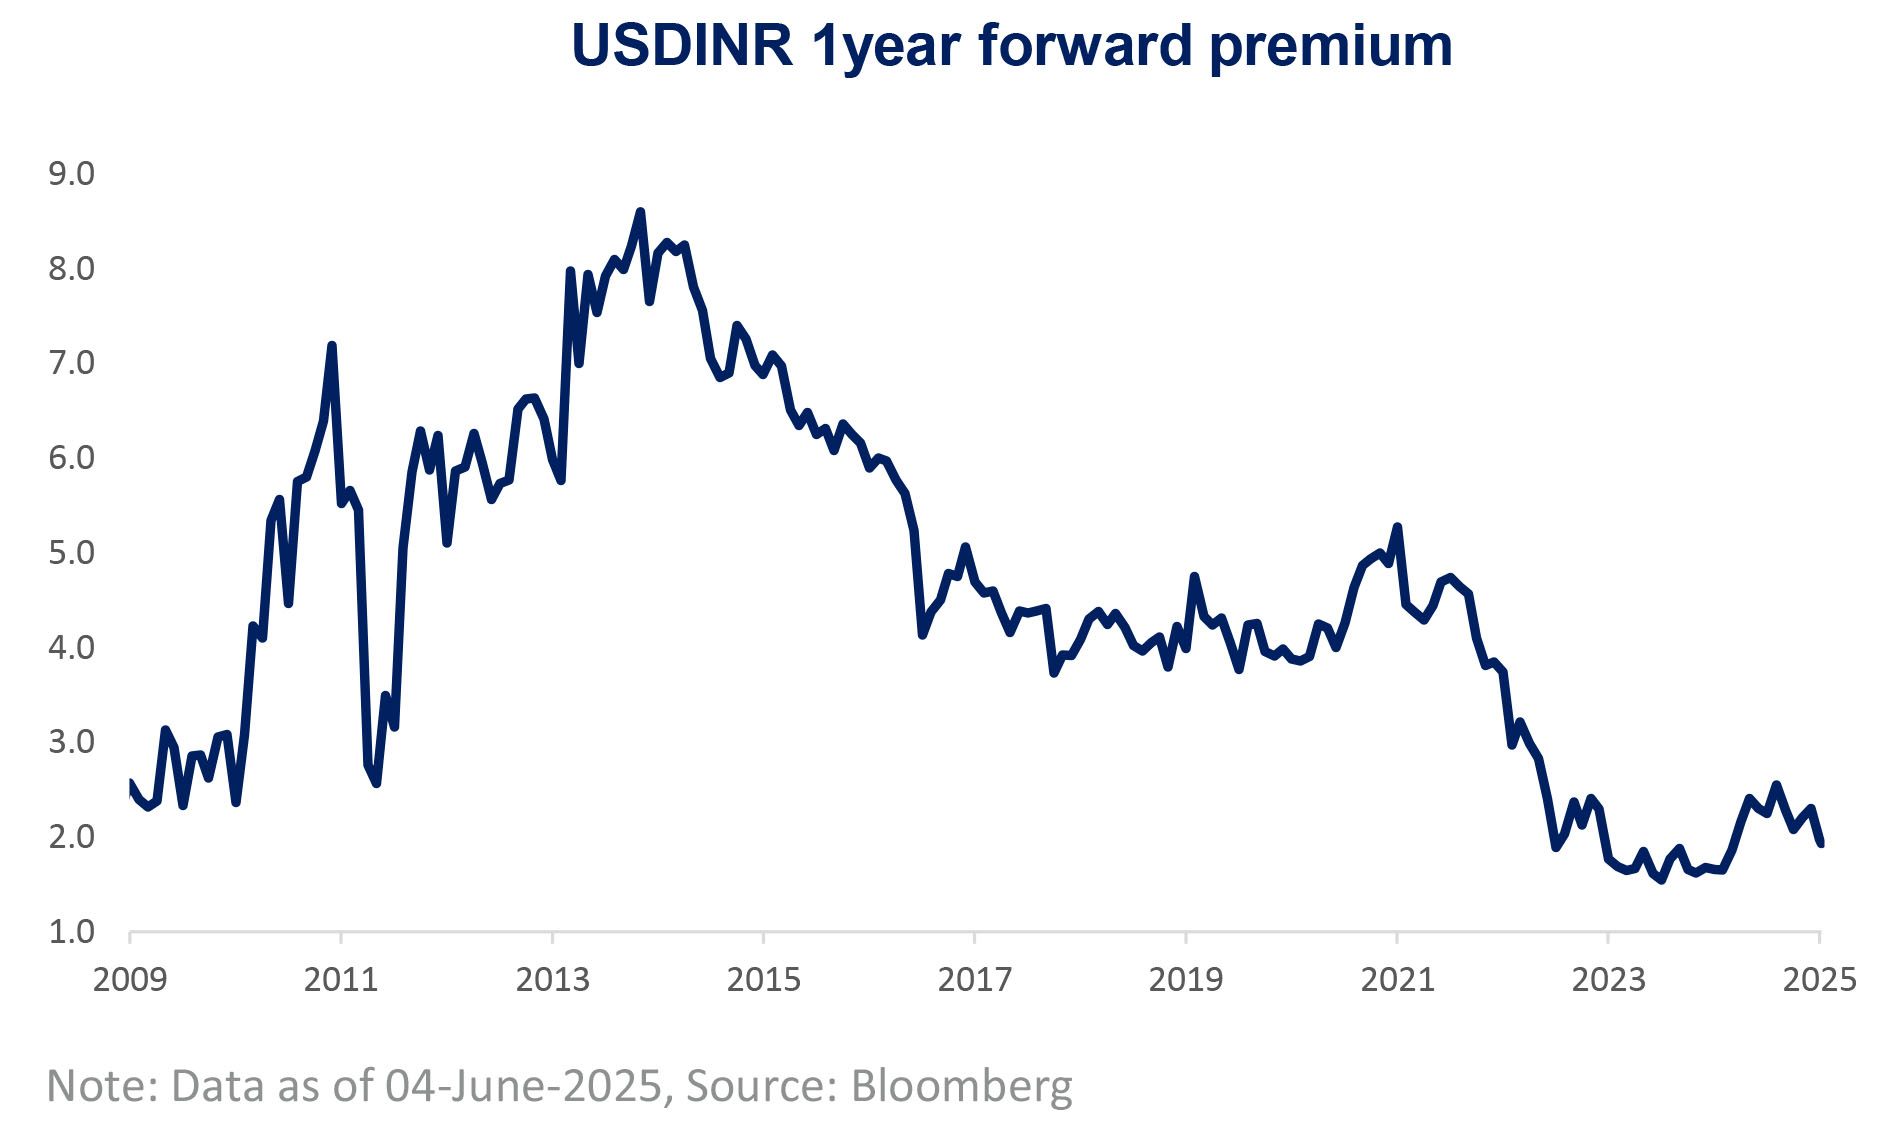
• While most Asian currencies appreciated against the USD, INR was one of the worst performing currencies. In contrast, the INR slipped 1.6% since April. Nevertheless, the forward premium of the USDINR continued to decline, with the 1-year premium falling to a nine-month low of 1.92%
• INR underperformed despite USD weakness largely
• USDINR forward premium lowest since GFC crisis
| ▮ |
Gold prices recover |
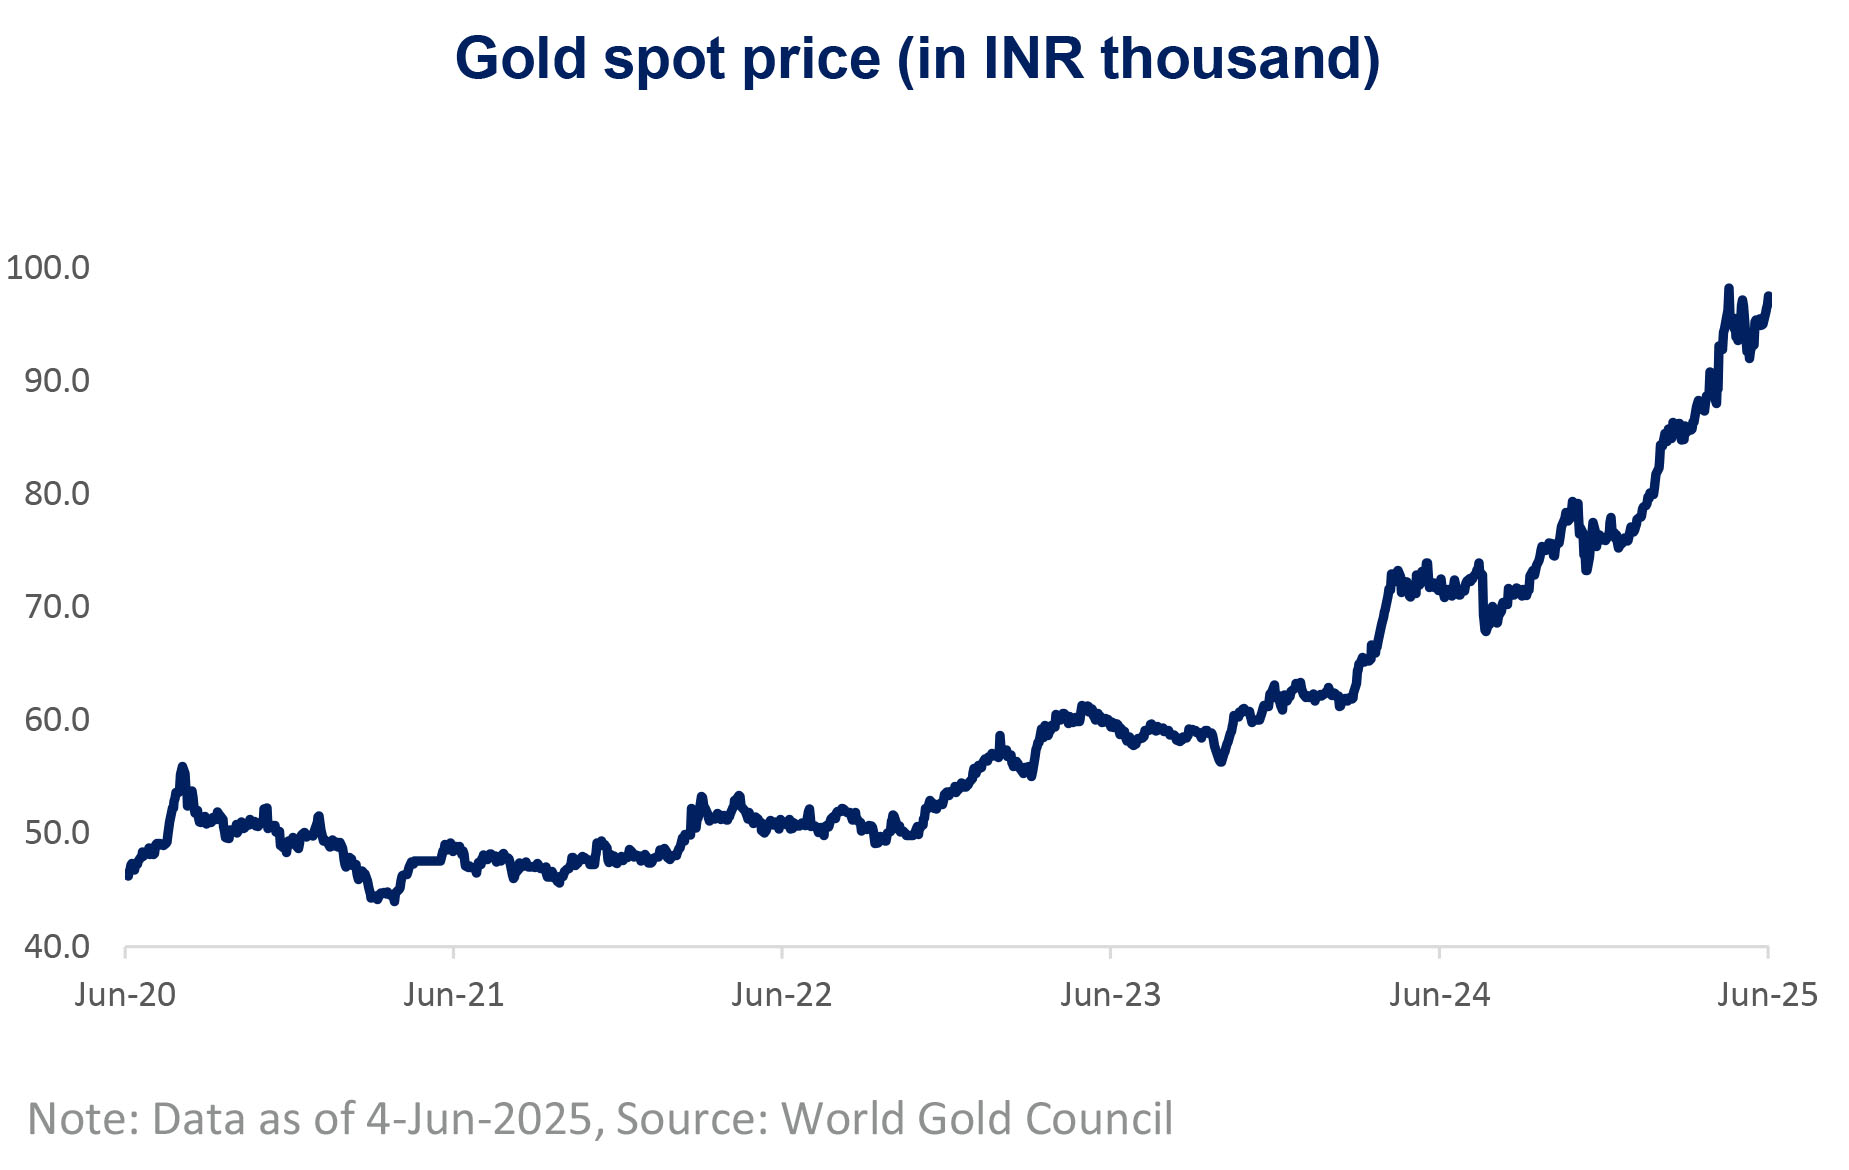
• Gold price has moved higher, with it trading back above USD 3300 per/oz. They remain elevated due to strong central bank buying and lingering uncertainty around U.S. monetary policy. Gold demand remains robust, particularly from central banks and investors, as gold continues to serve as a hedge against geopolitical risks and inflation concerns
• Gold prices in India nearing its all-time high again after a short blip in April
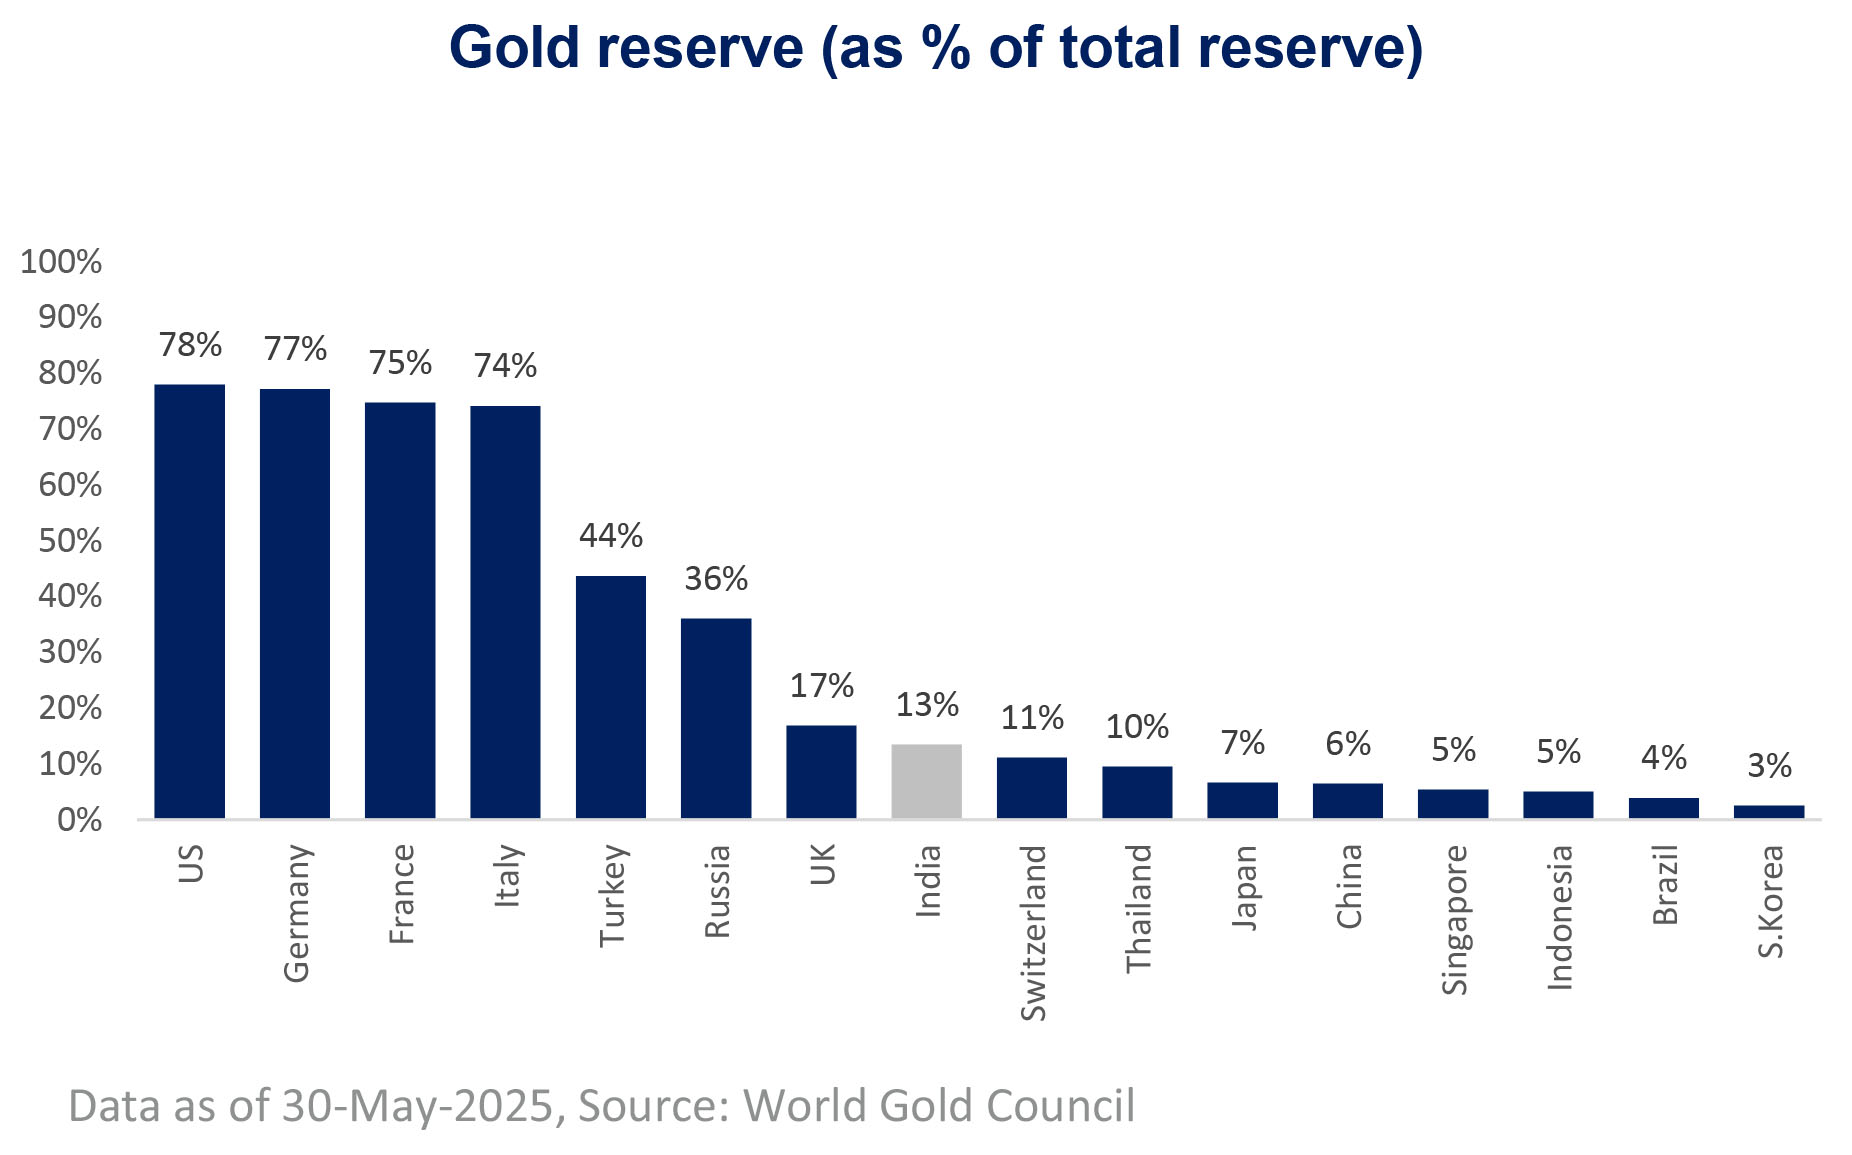
• India's gold reserve as % of total reserves continue to grow having more than doubled in last four years
| ▮ |
Domestic Indicators suggest Neutral weight to equity |

Data as on 05th June 2025, Source: Bloomberg
| ▮ |
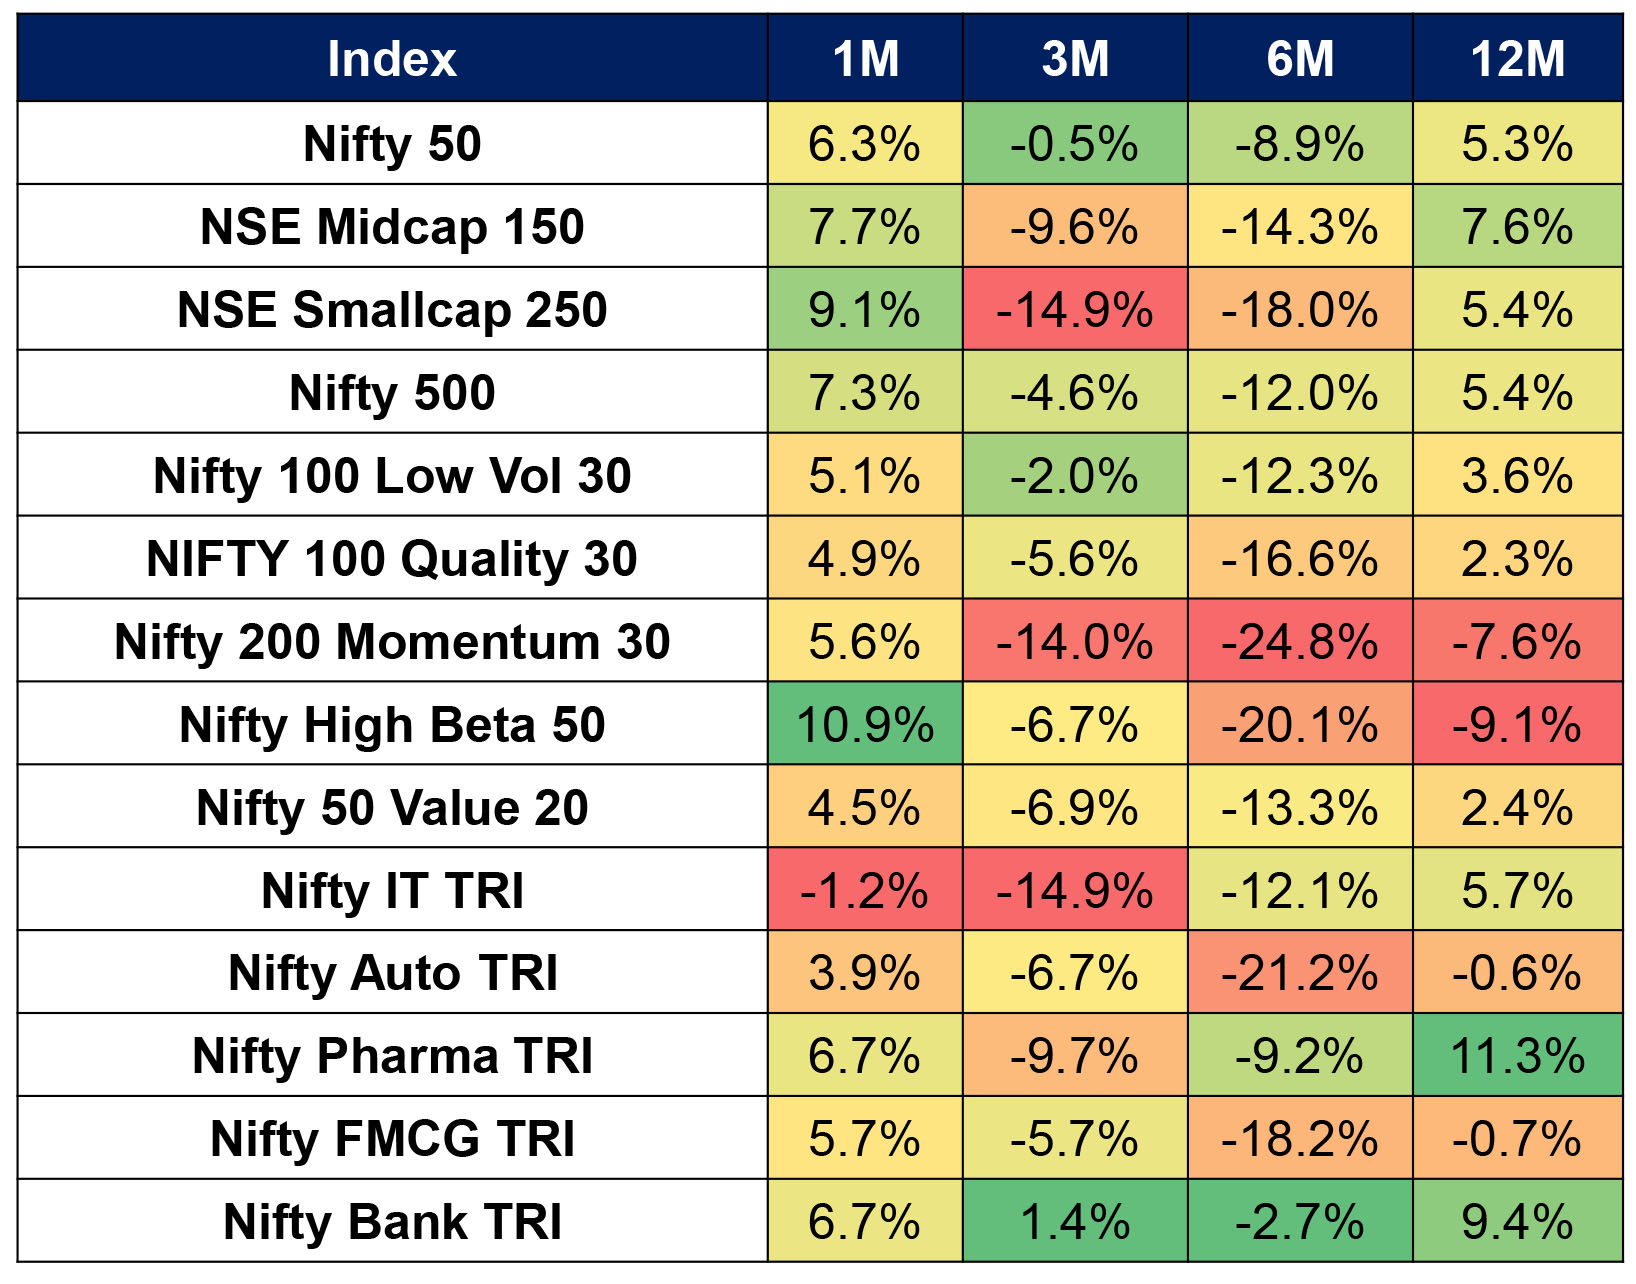
Domestic market performance |
Benchmark, Factor Indices & Sectoral Performance
Equity MF Category wise Performance (in %)
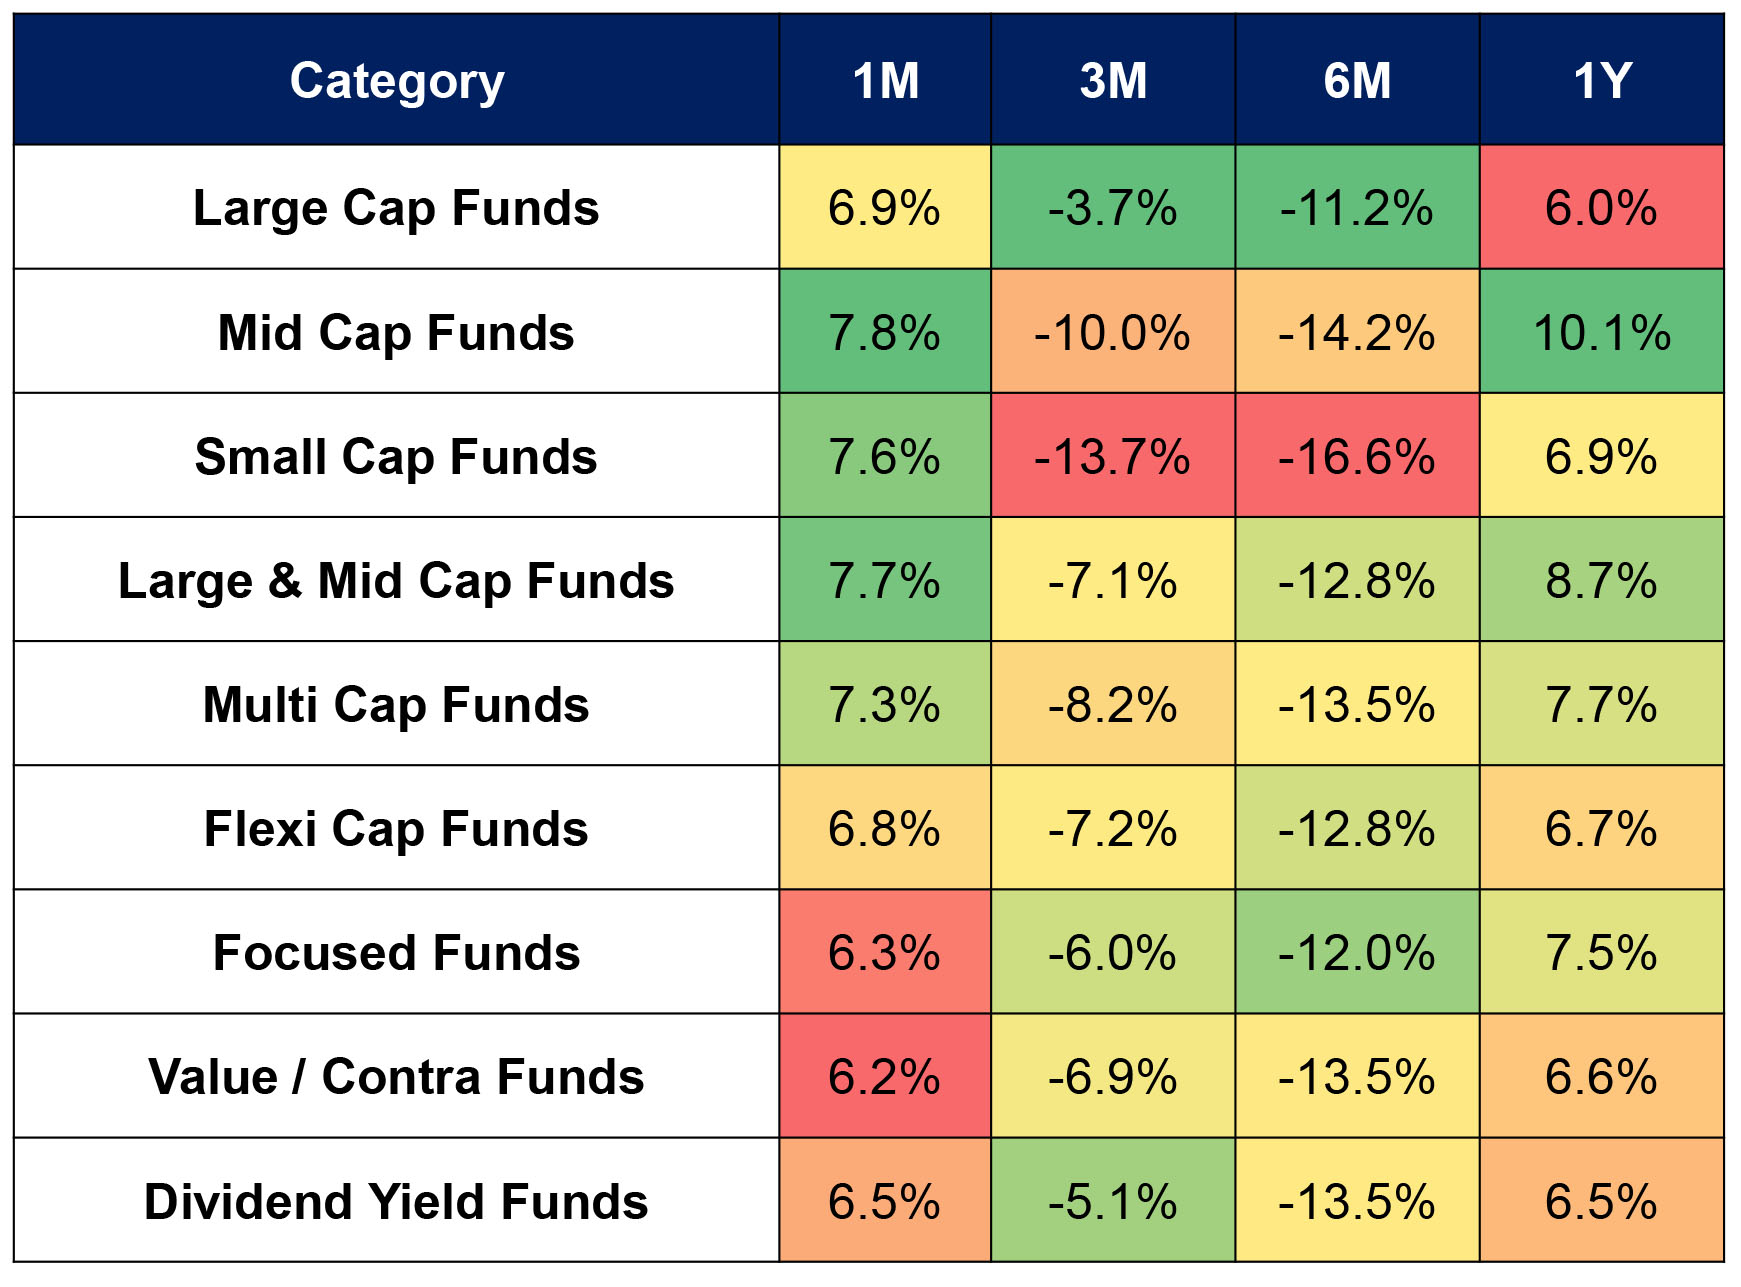
Data as on 31st May 2025, Source: Bloomberg
| ▮ |
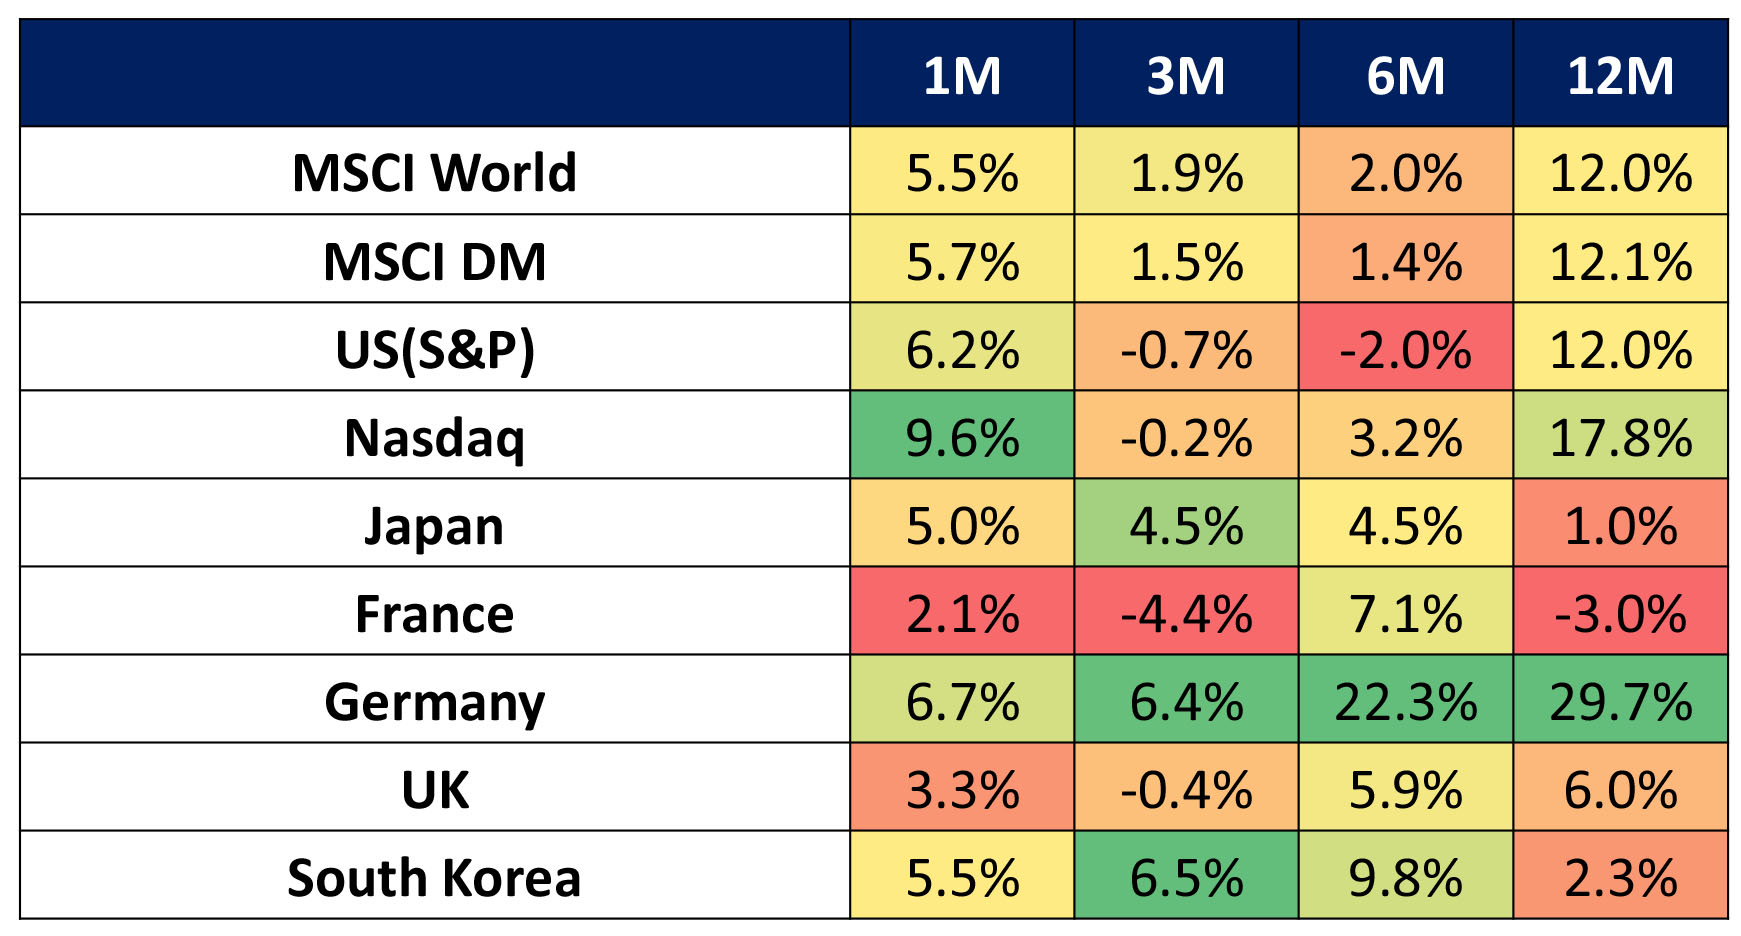
Global market performance |
Developed Market Performance
Emerging Market Performance
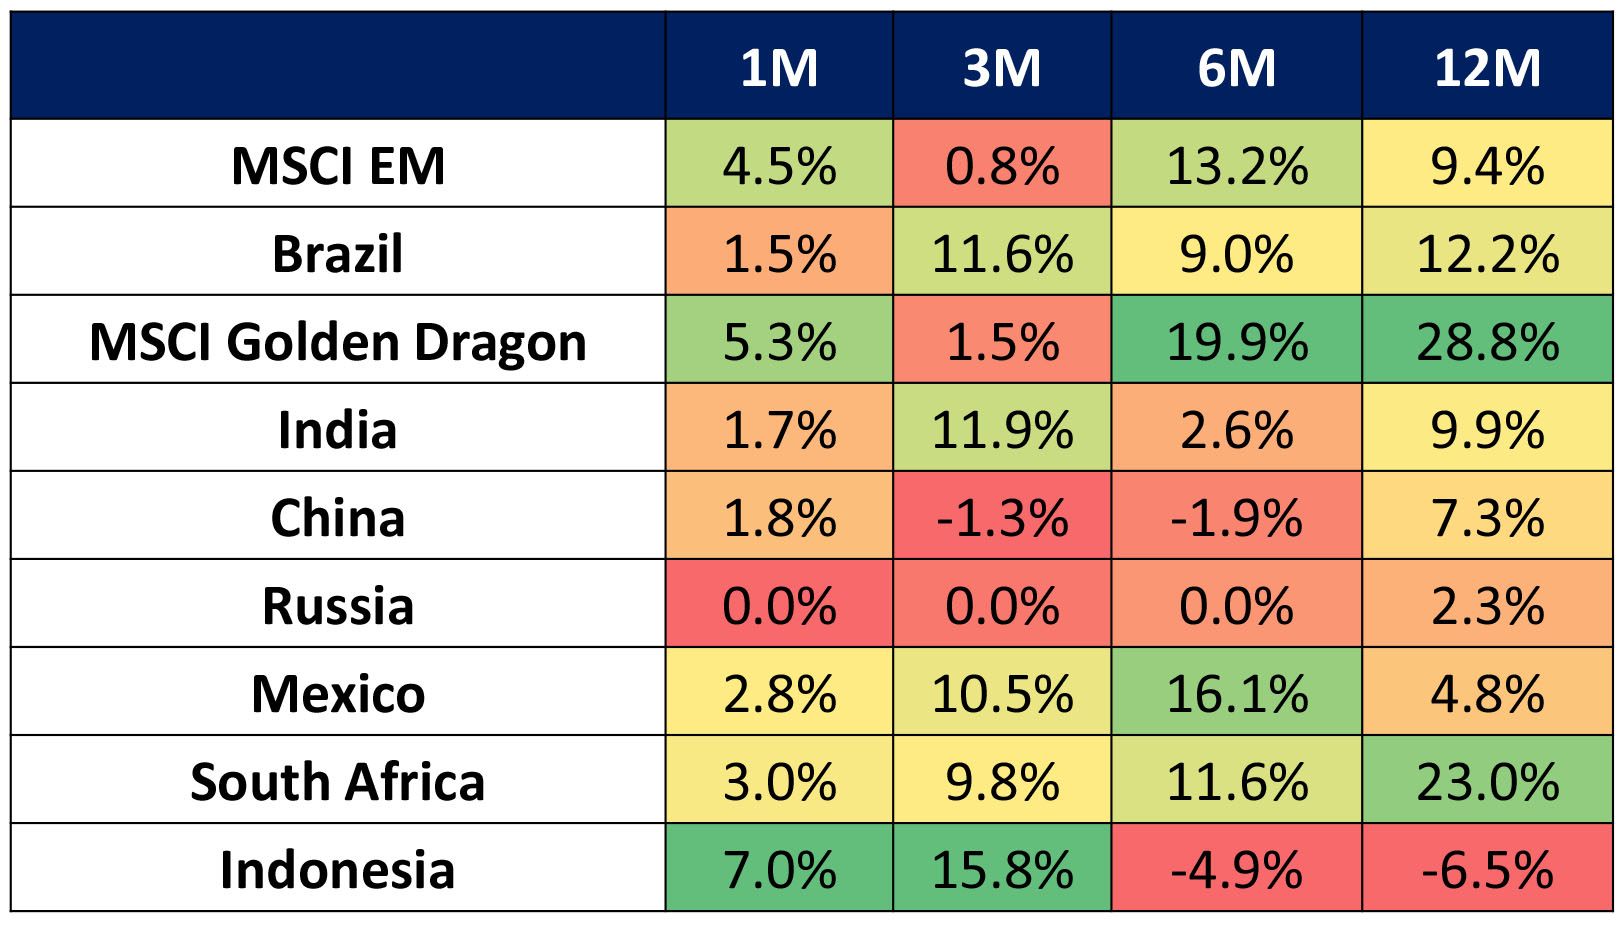
Data as on 31st May 2025, Source: Bloomberg
| ▮ |
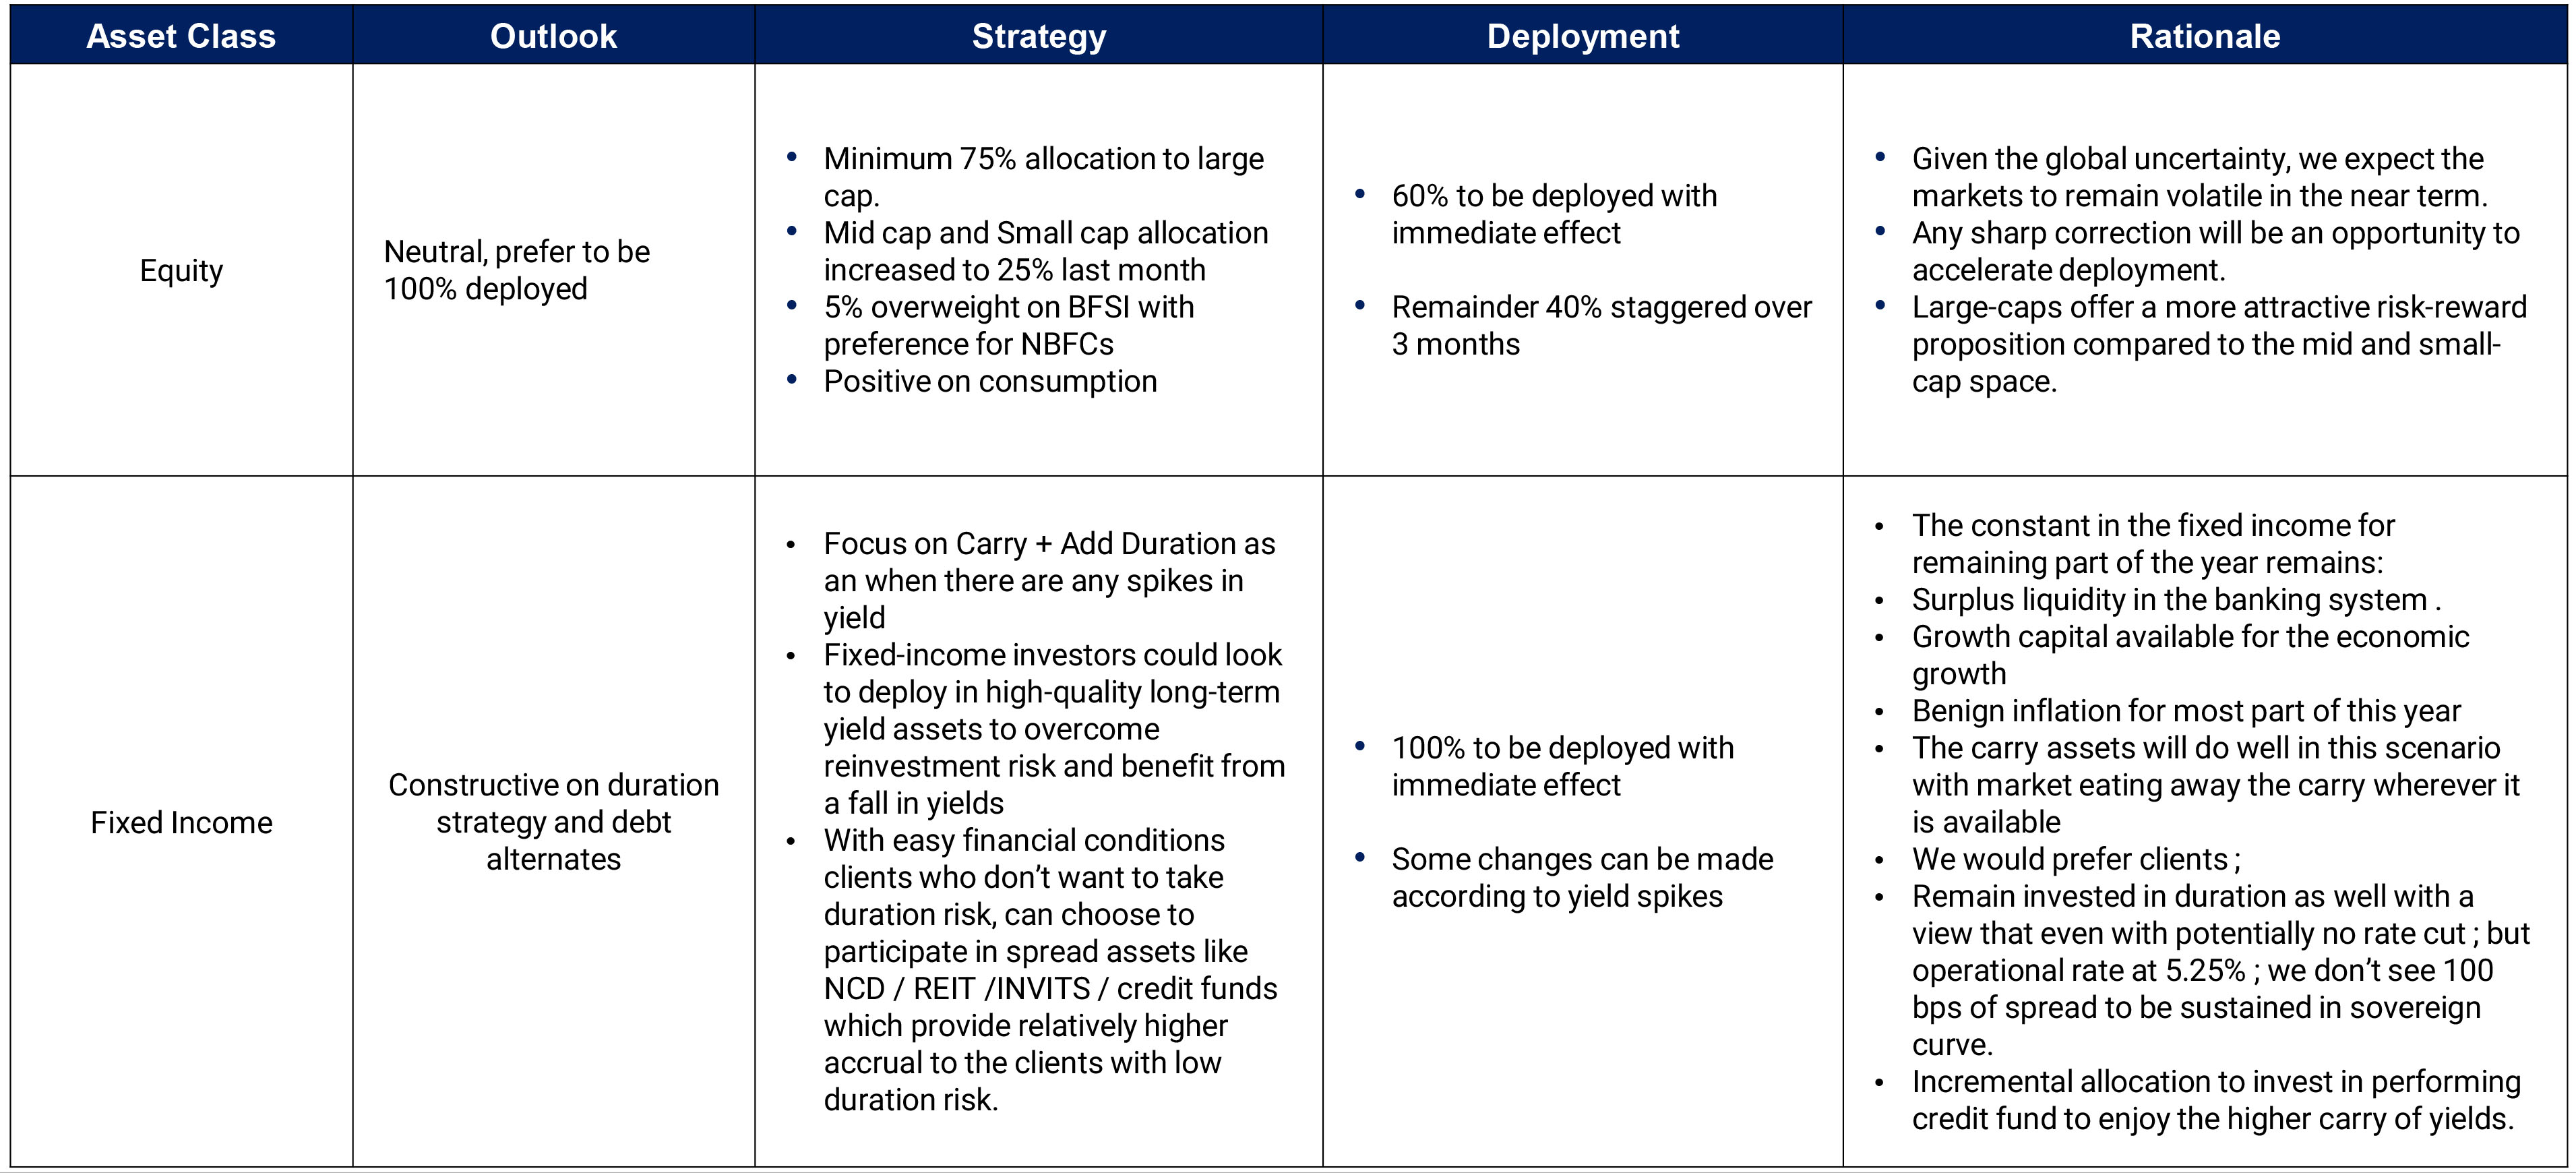
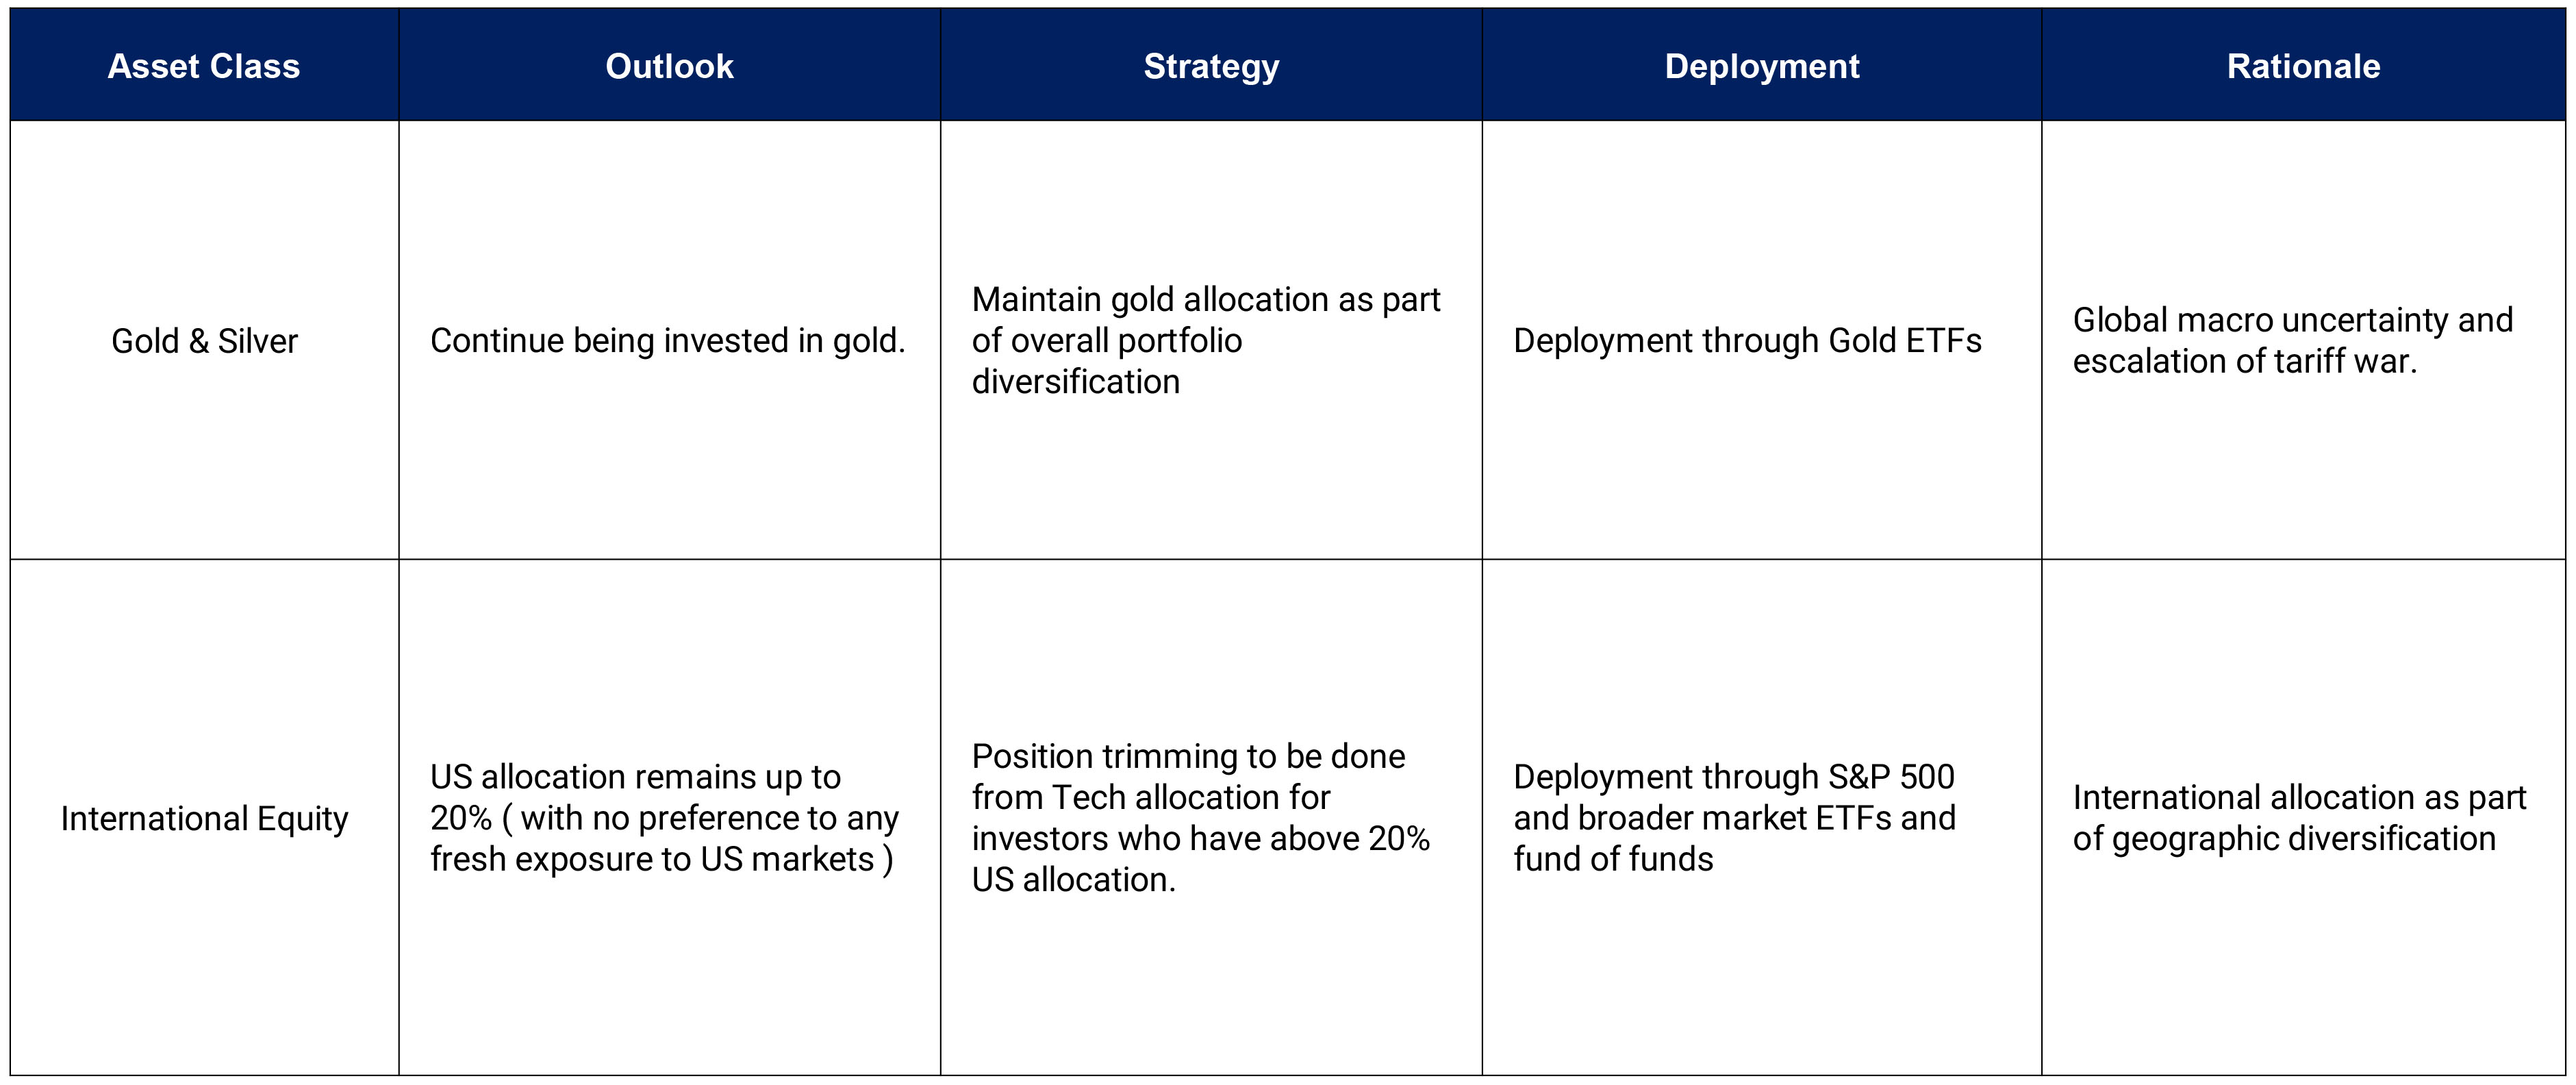
Investment Summary |
| ▮ |
Recommended Equity Funds' Performances |
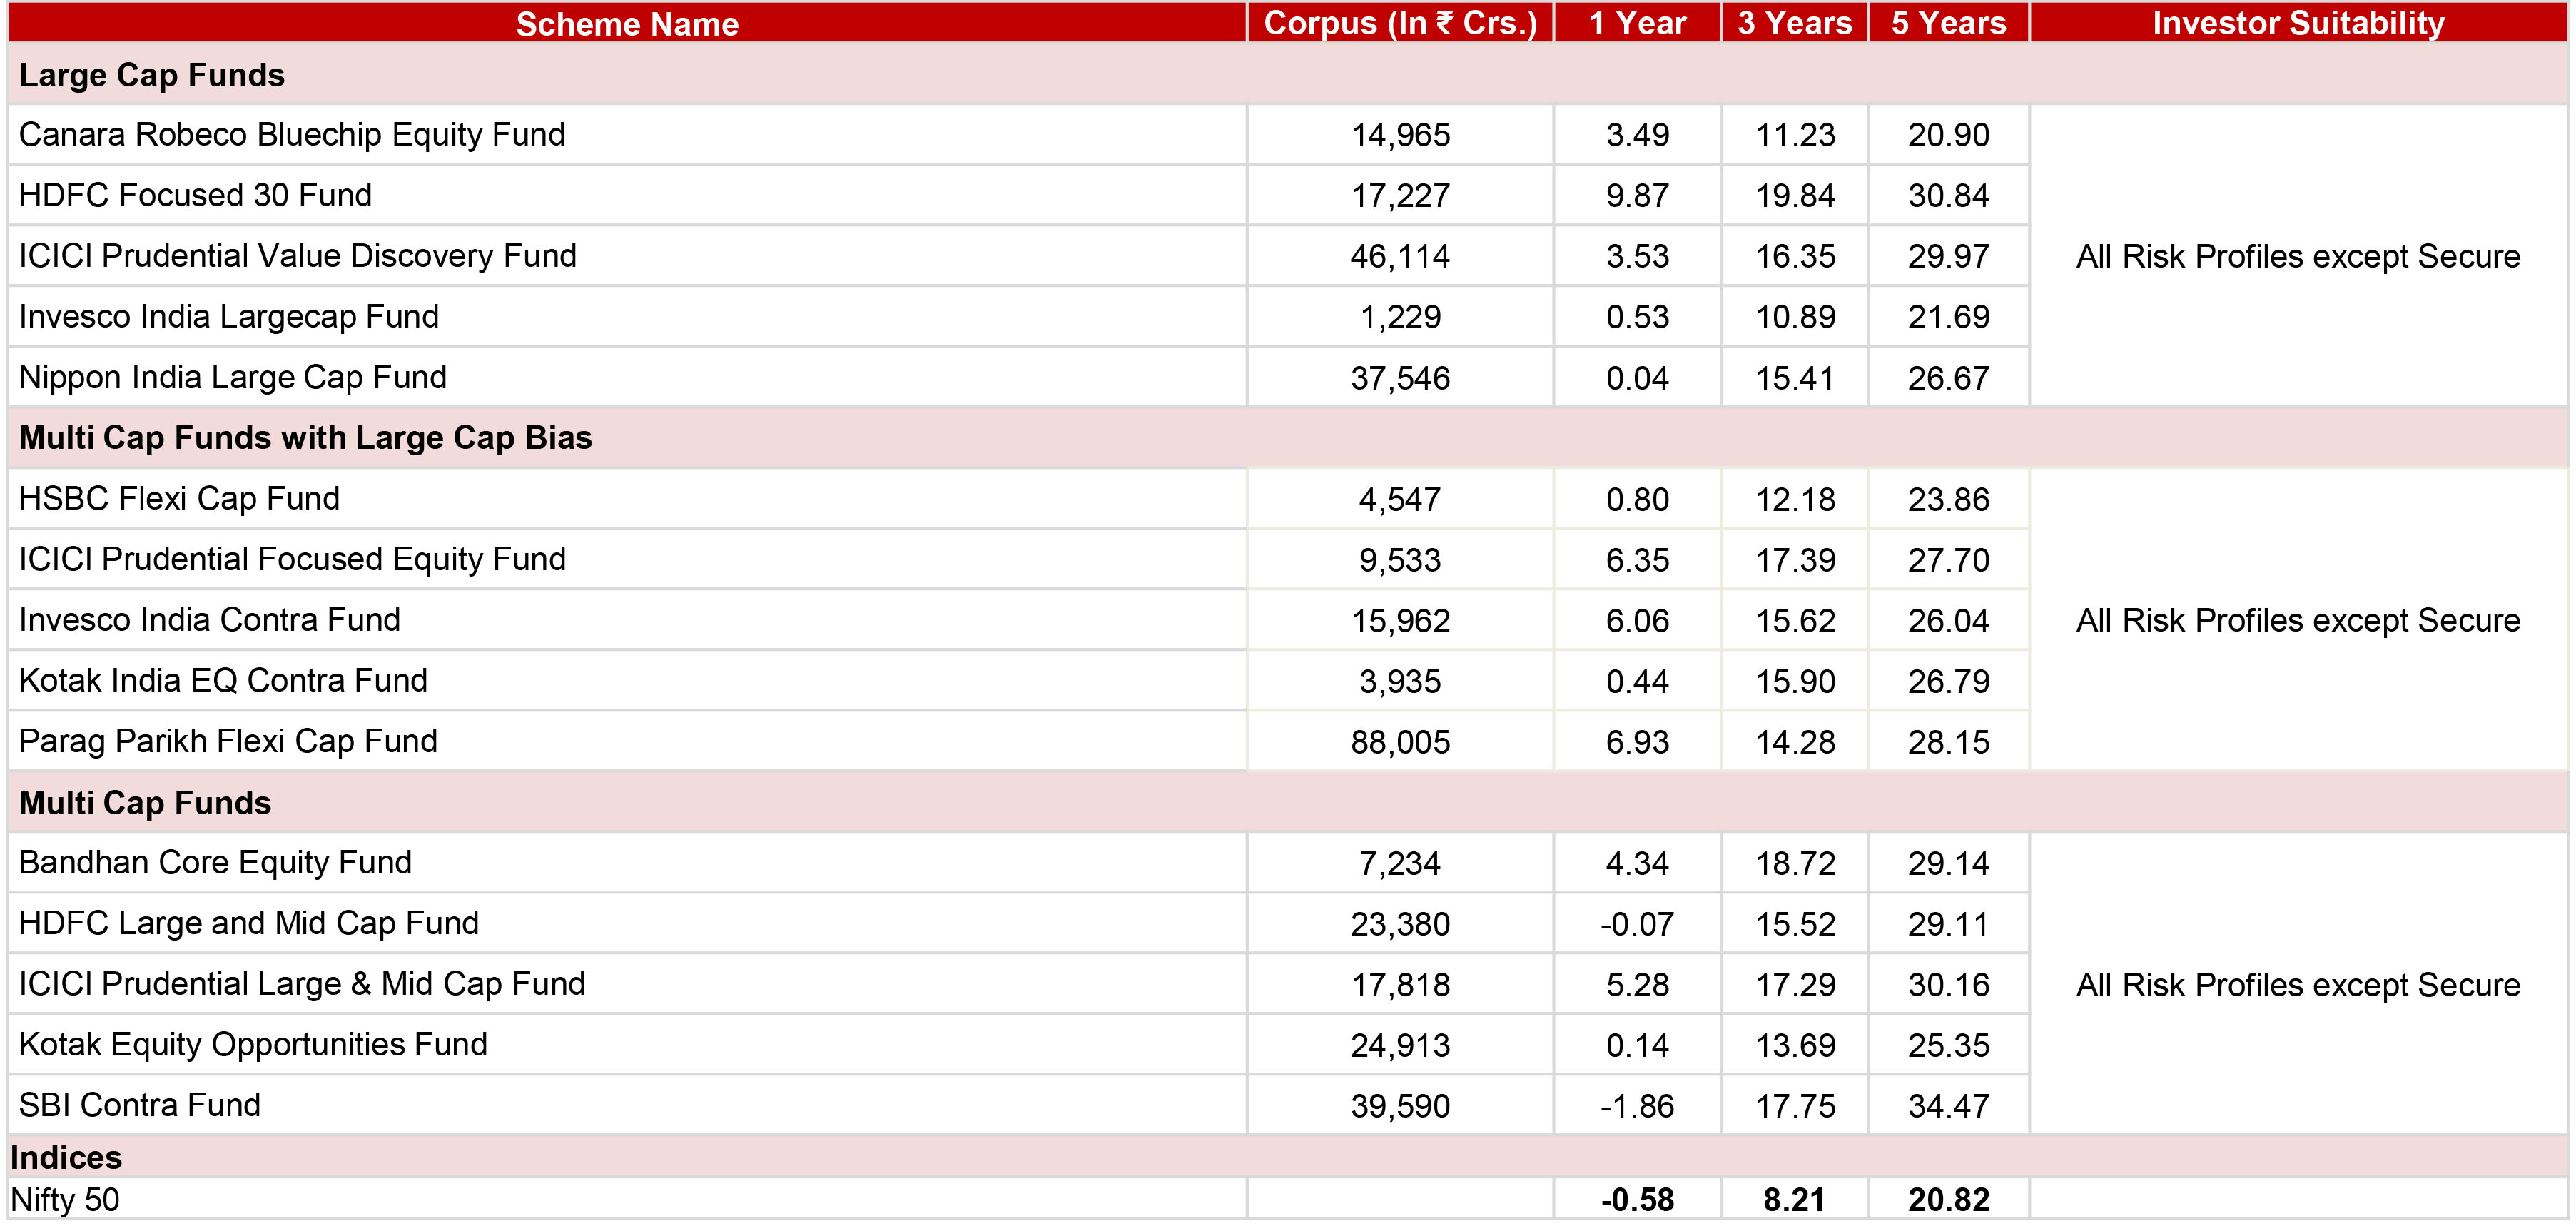
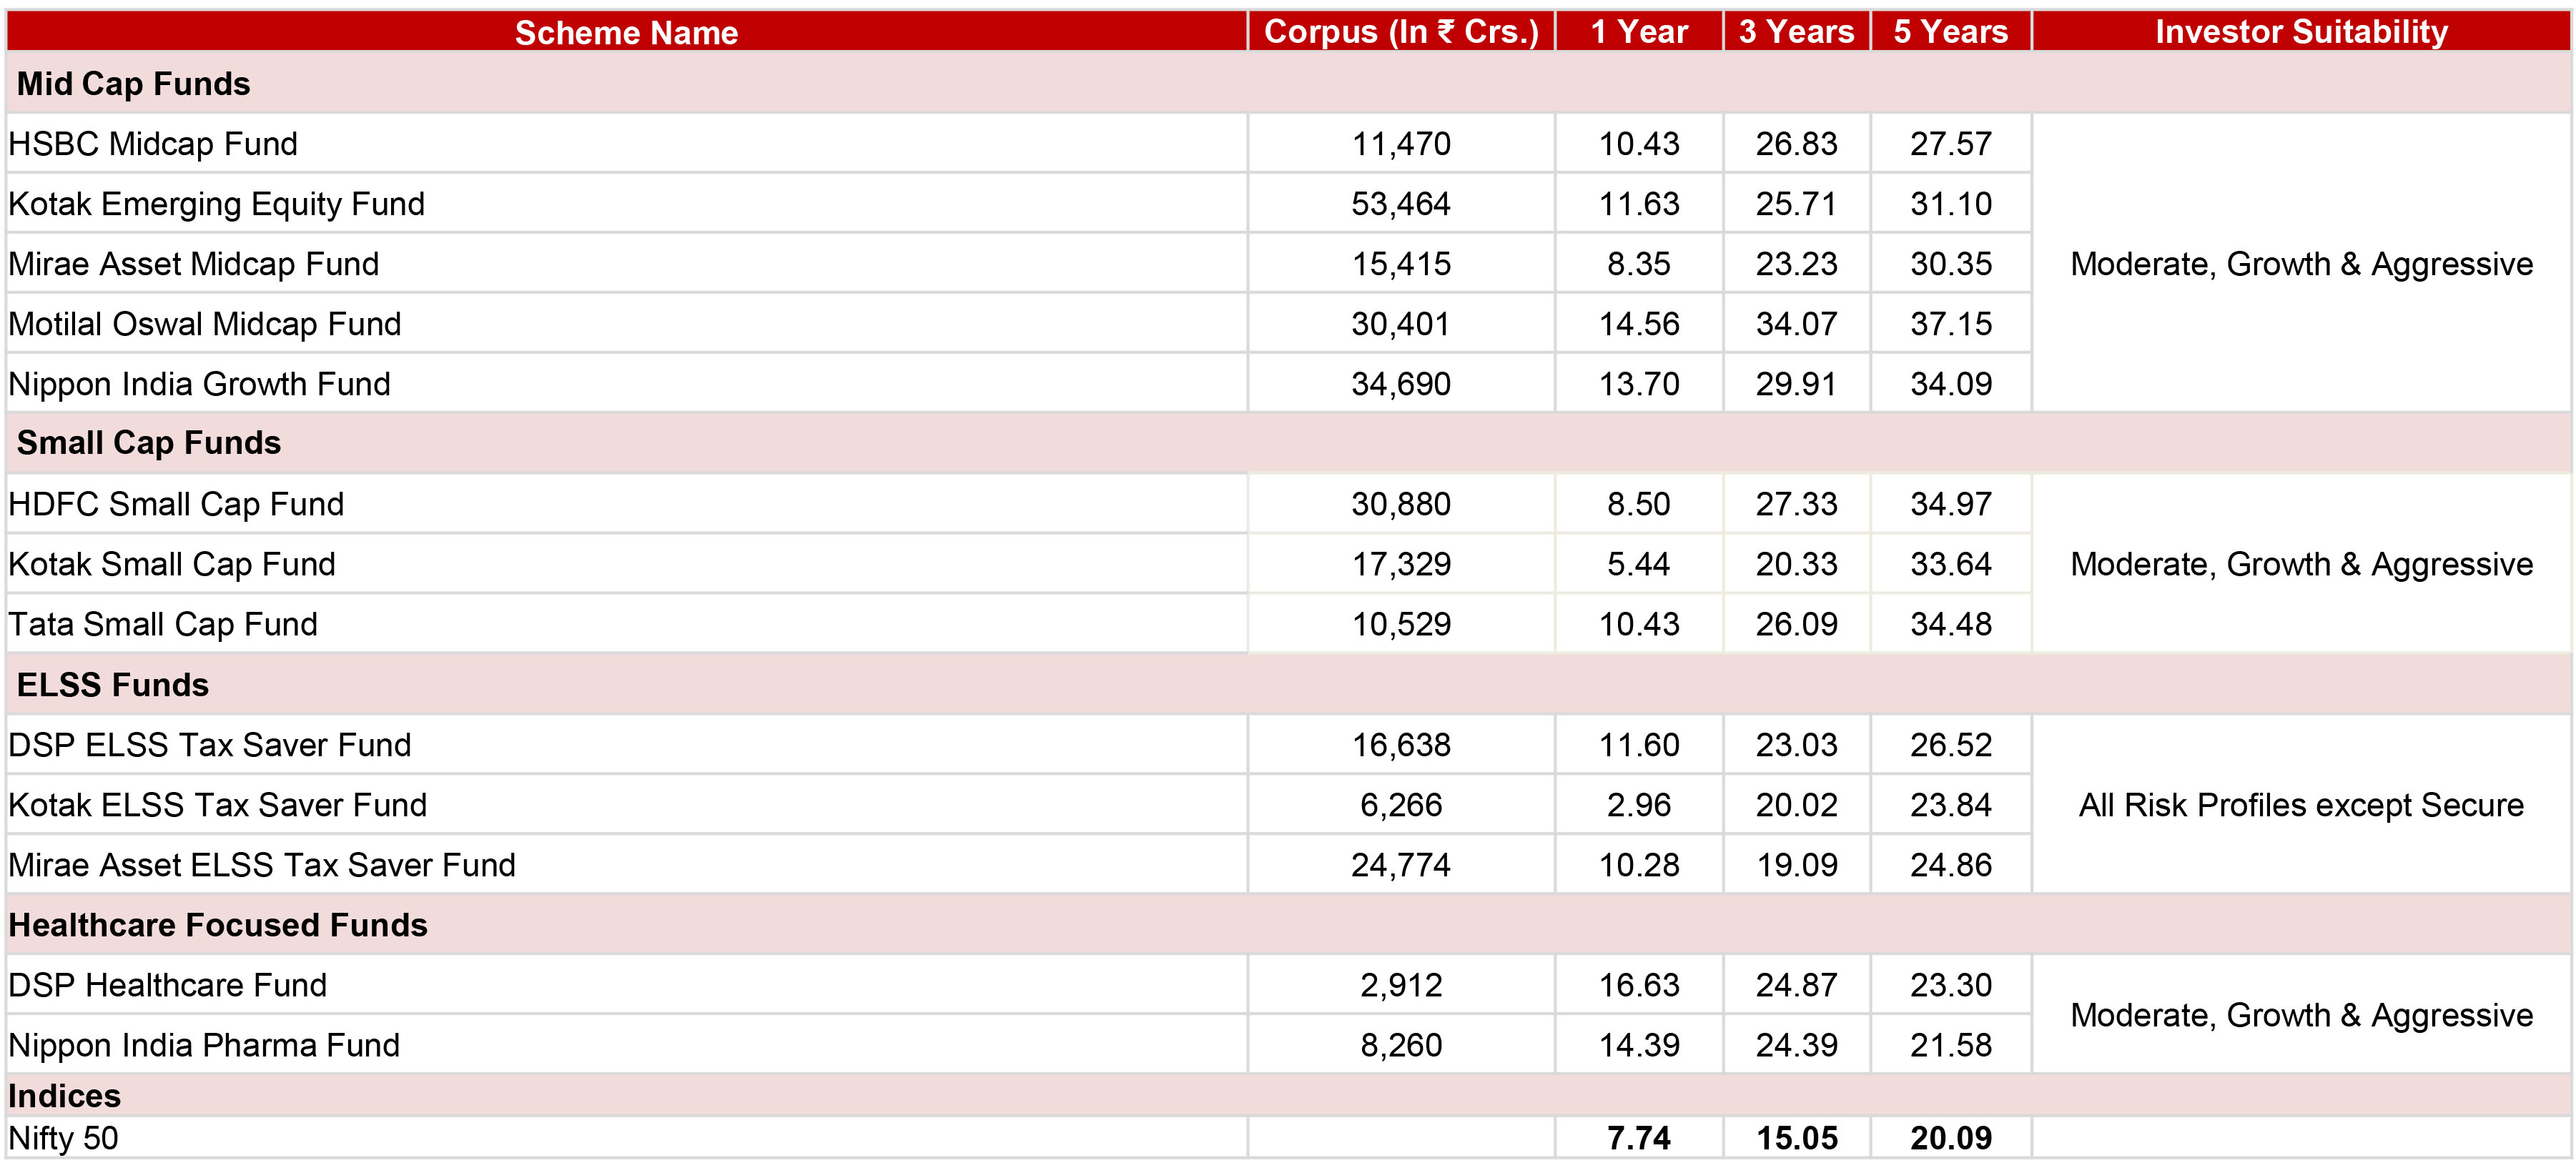
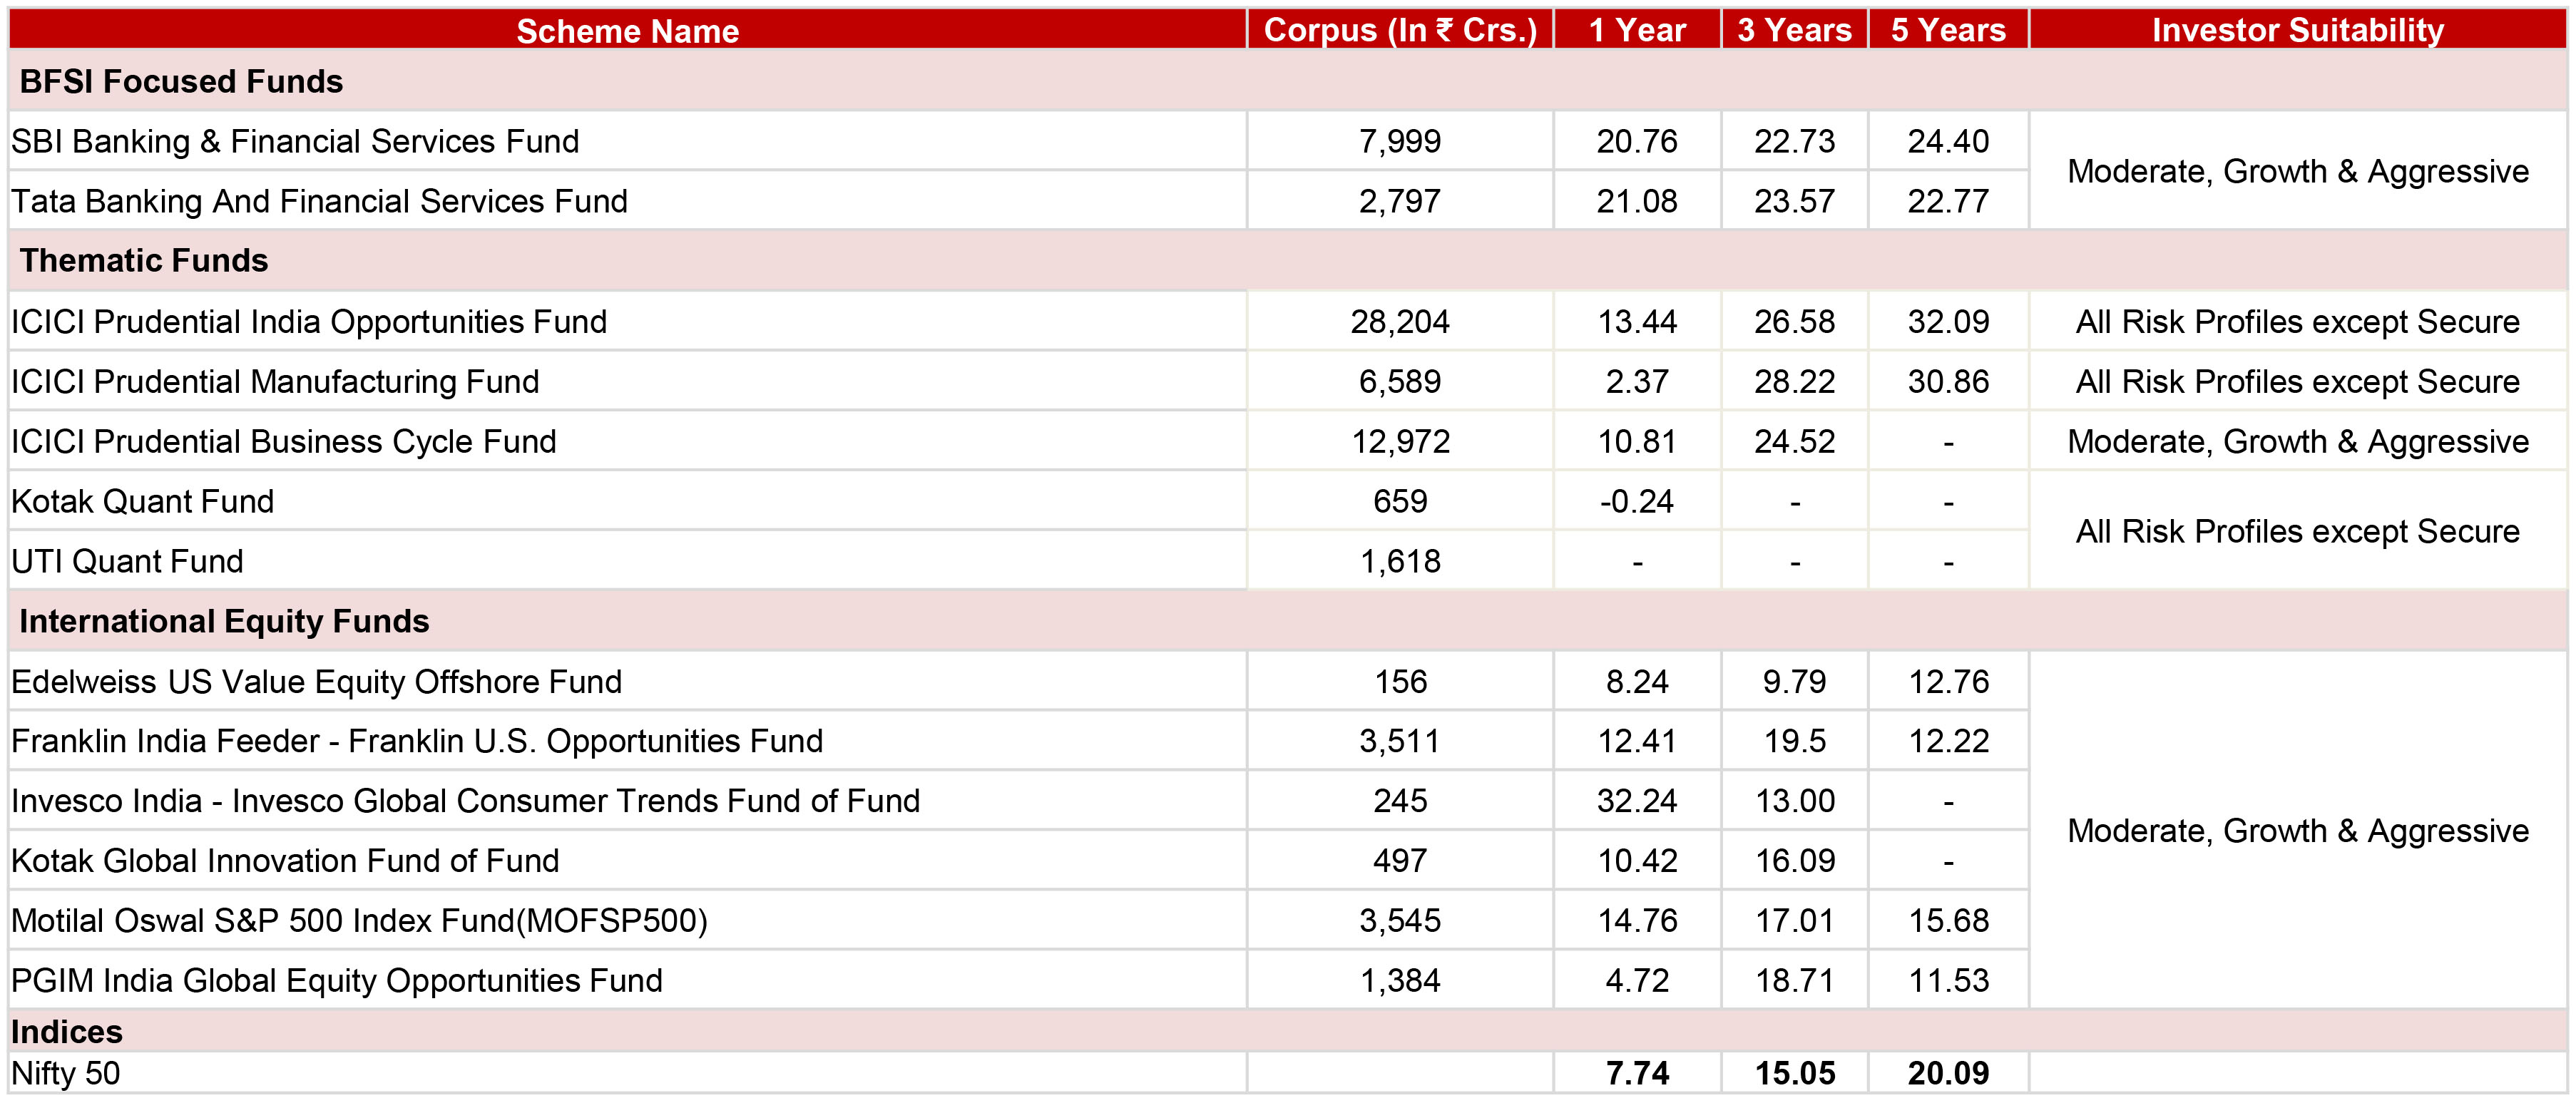

Source: MFI Explorer Returns are CAGR as on June 09, 2025 and for Regular Plans with Growth option. Corpus size is as on May, 2025.
| ▮ |
Recommended Hybrid Funds' Performances |
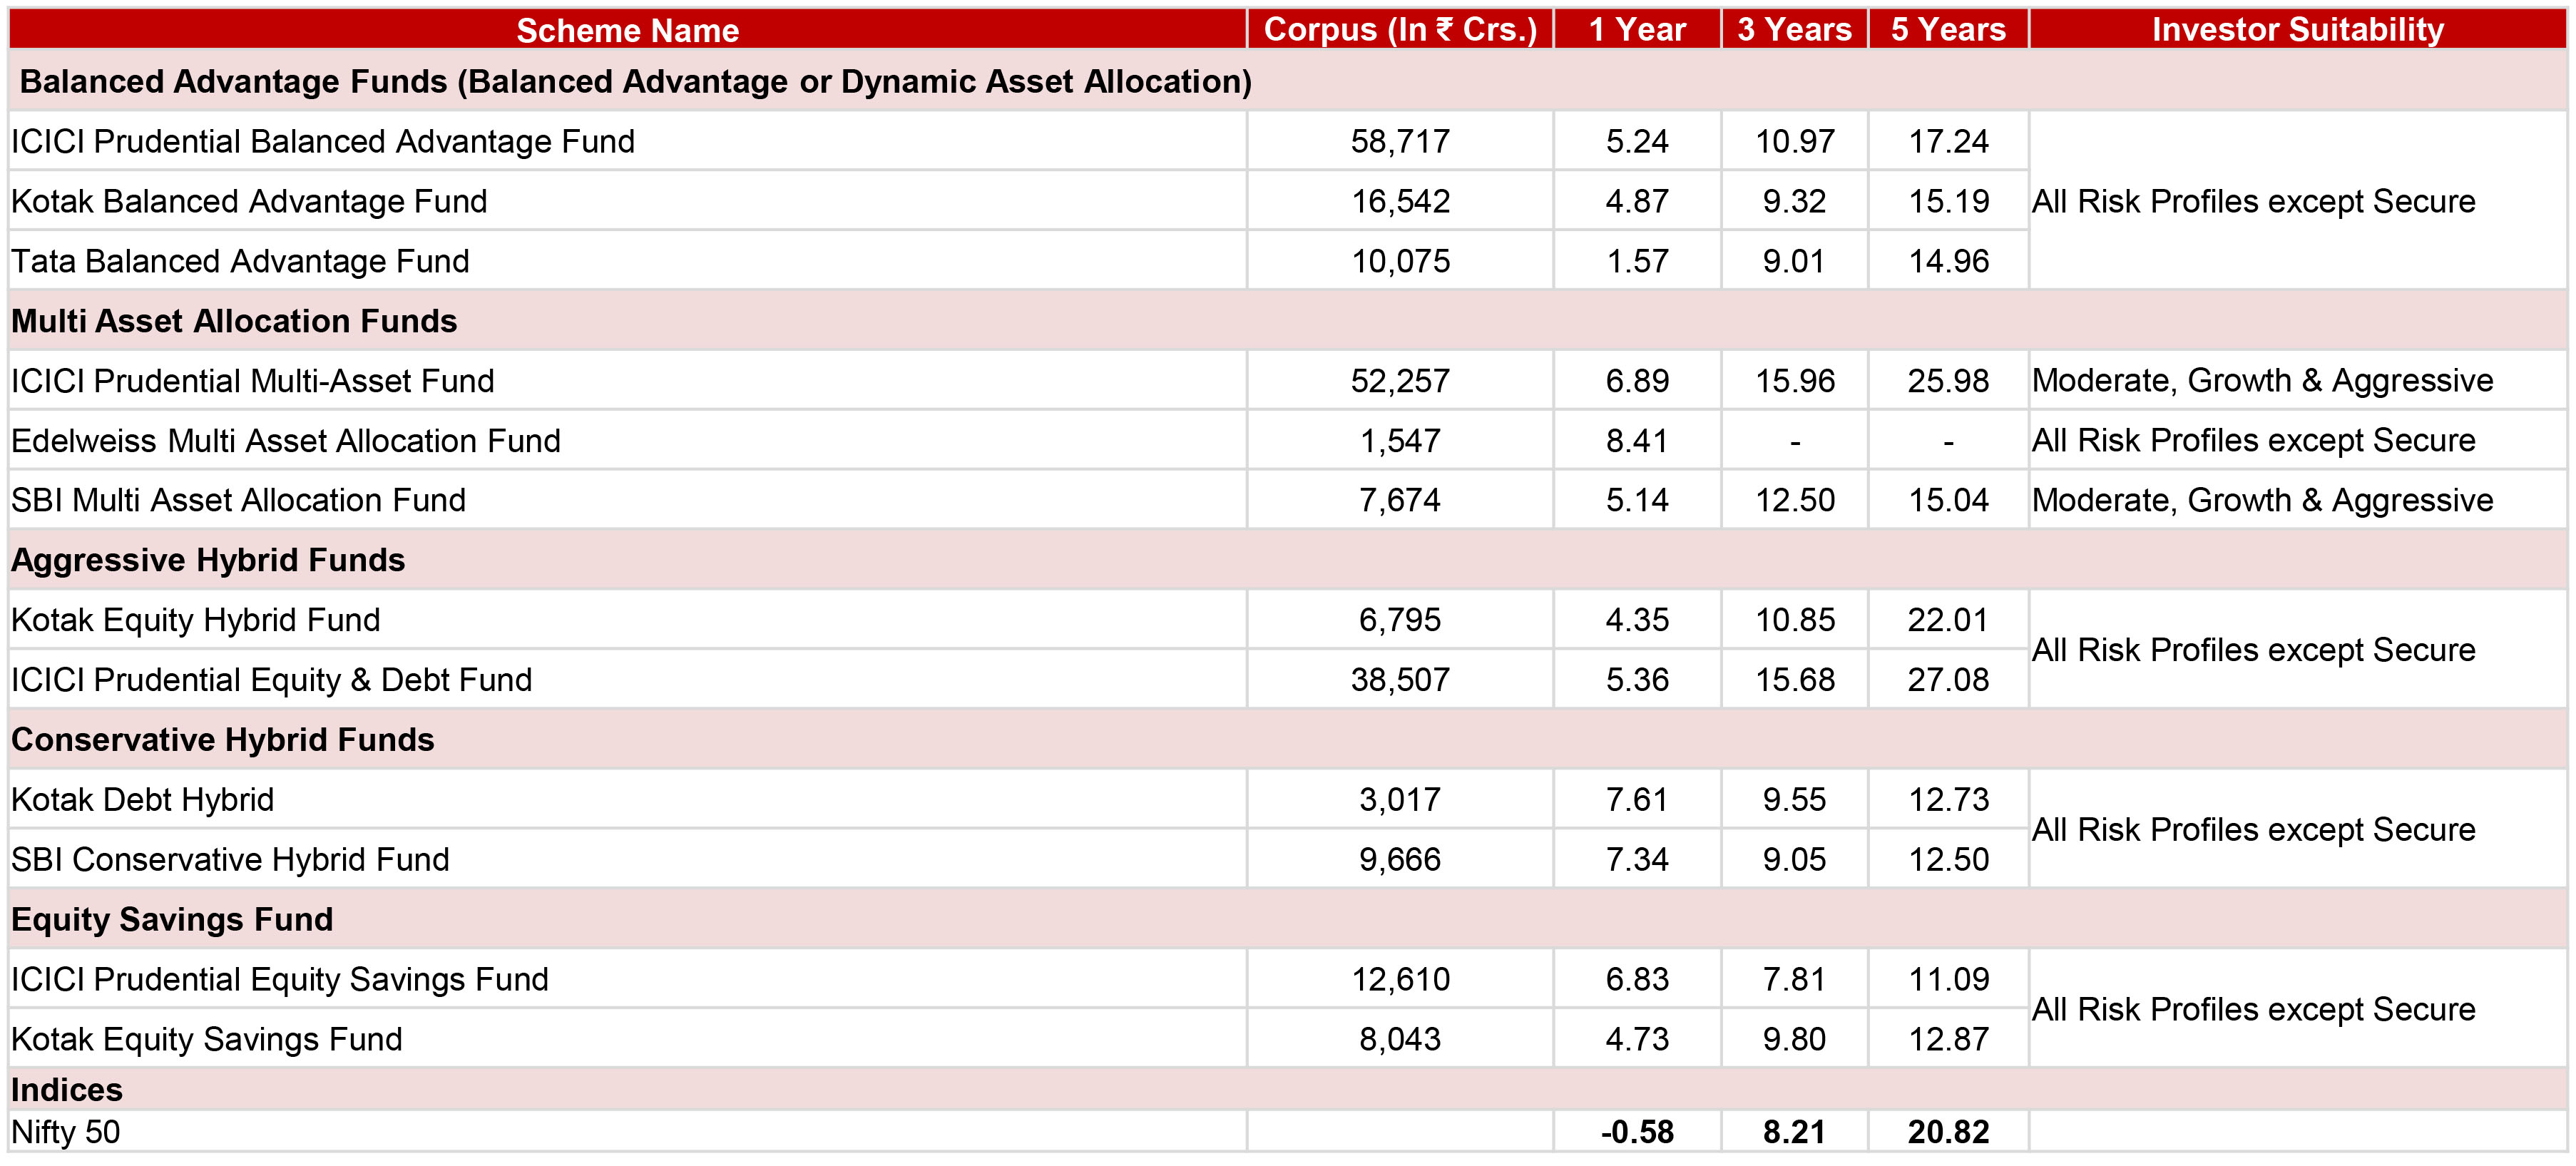
Source: MFI Explorer Returns are CAGR as on June 09, 2025 and for Regular Plans with Growth option. Corpus size is as on May, 2025.
| ▮ |
Recommended Debt Funds' Performances |

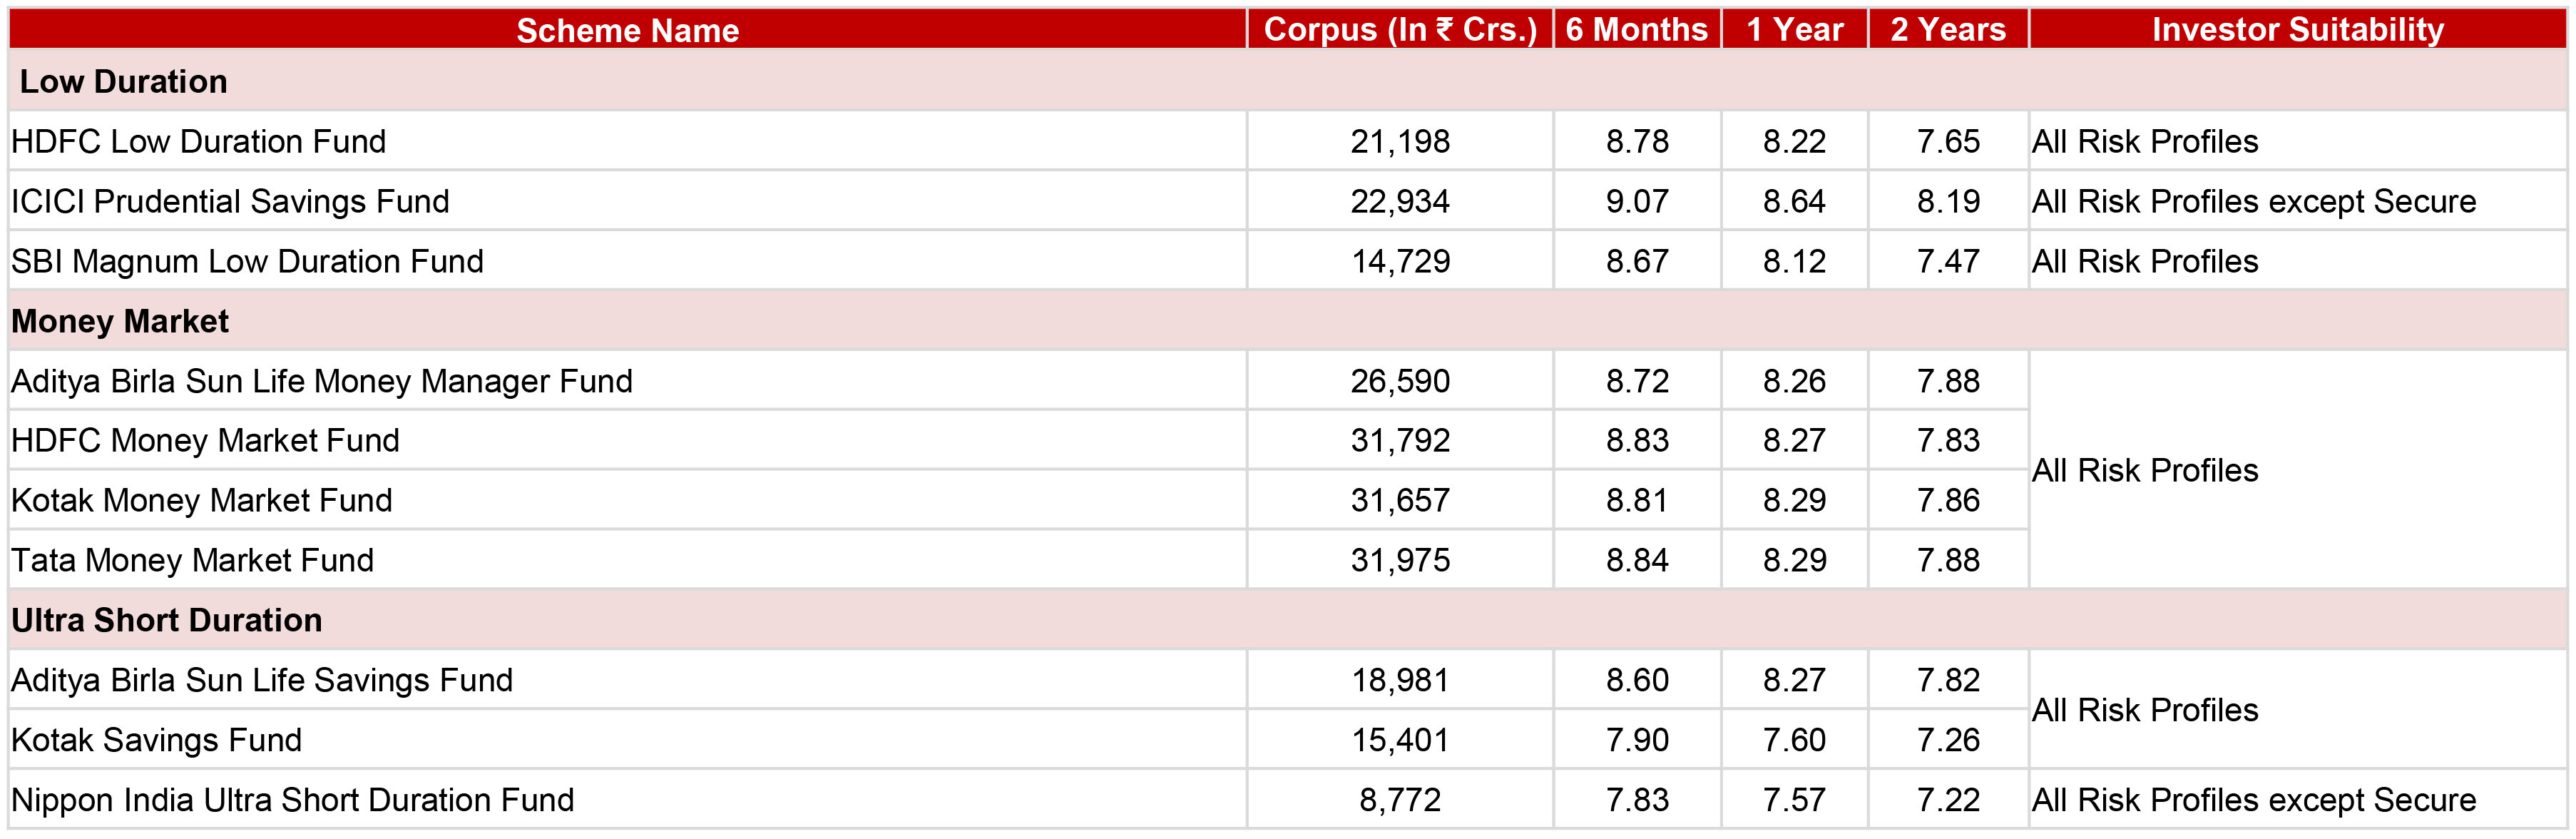

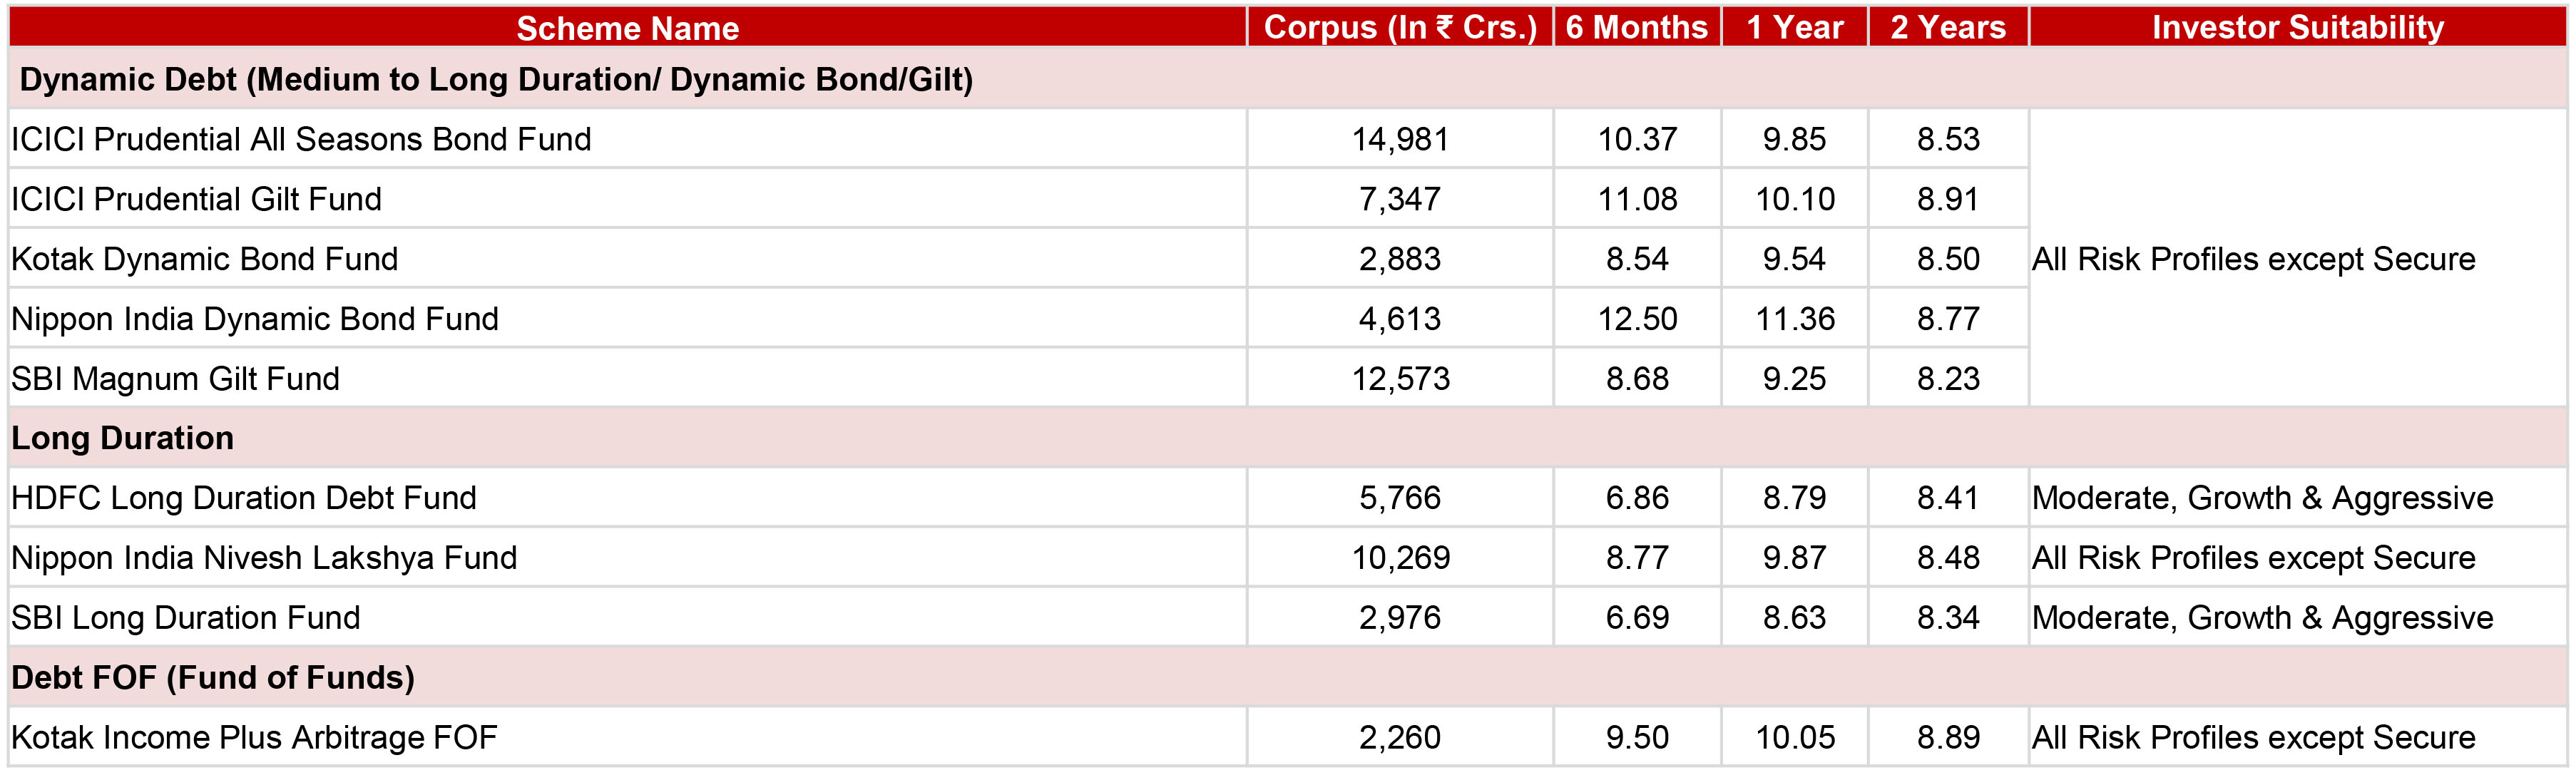
Source: MFI Explorer. Less than 1 year Simple Annualized returns, Greater than or Equal to 1 year Compound Annualized returns. Returns as on June 09, 2025 and for Regular Plans with Growth option. Corpus size is as on May, 2025.
| ▮ | Disclaimer |
In the preparation of the material contained in this document, Kotak Mahindra Bank Ltd, has used information that is publicly available, including information developed in house. Some of the material used in the document may have been obtained from members/ persons other than the Kotak Mahindra Bank Ltd and / or its affiliates and which may have been made available to Kotak Mahindra Bank Ltd and / or its affiliates. Information gathered & material used in this document is believed to be from reliable sources.Kotak Mahindra Bank Ltd however does not warrant the accuracy, reasonableness and / or completeness of any information. For data reference to any third party in this material no such party will assume any liability for the same.Kotak Mahindra Bank Ltd and / or any affiliate of Kotak Mahindra Bank Ltd does not in any way through this material solicit any offer for purchase, sale or any financial transaction / commodities / products of any financial instrument dealt in this material. All recipients of this material should before dealing and or transacting in any of the products referred to in this material make their own investigation, seek appropriate professional advice.
We have included statements / opinions / recommendations in this document which contain words or phrases such as "will", "expect" "should" and similar expressions or variations of such expressions, that are "forward looking statements". Actual results may differ materially from those suggested by the forward looking statements due to risks or uncertainties associated with our expectations with respect to, but not limited to, exposure to market risks, general economic and political conditions in India and other countries globally, which have an impact on our services and / or investments, the monetary and interest policies of India, inflation, deflation, unanticipated turbulence in interest rates, foreign exchange rates, equity prices or other rates or prices, the performance of the financial markets in India and globally, changes in domestic and foreign laws, regulations and taxes and changes in competition in the industry. By their nature, certain market risk disclosures are only estimates and could be materially different from what actually occurs in the future. As a result, actual future gains or losses could materially differ from those that have been estimated.
Kotak Mahindra Bank Ltd(including its affiliates) and any of its officers directors, personnel and employees, shall not liable for any loss, damage of any nature, including but not limited to direct, indirect, punitive, special, exemplary, consequential, as also any loss of profit in any way arising from the use of this material in any manner. The recipient alone shall be fully responsible / are liable for any decision taken on the basis of this material. The investments discussed in this material may not be suitable for all investors. Any person subscribing to or investing in any product / financial instruments should do so on the basis of and after verifying the terms attached to such product / financial instrument. Financial products and instruments, are subject to market risks and yields may fluctuate depending on various factors affecting capital / debt markets.Please note that past performance of the financial products and instruments does not necessarily indicate the future prospects and performance thereof.Such past performance mayor may not be sustained in future. Kotak Mahindra Bank Ltd(including its affiliates) or its officers, directors, personnel and employees, including persons involved in the preparation or issuance of this material may; (a) from time to time, have long or short positions in, and buy or sell the securities mentioned herein or(b) be engaged in any other transaction involving such securities and earn brokerage or other compensation in the financial instruments / products / commodities discussed herein or act as advisor or lender / borrower in respect of such securities / financial instruments / products / commodities or have other potential conflict of interest with respect to any recommendation and related information and opinions. The said persons may have acted upon and / or in a manner contradictory with the information contained here. No part of this material may be duplicated in whole or in part in any form and or redistributed without the prior written consent of Kotak Mahindra Bank Ltd.This material is strictly confidential to the recipient and should not be reproduced or disseminated to anyone else Non-resident clients are advised to observe the limitations with regards to dealing in securities under the provisions of the Reserve Bank of India Act, 1934(2 of 1934) for Non-Resident clients since the same have not been considered while arriving at the recommendations / advice made in this presentation.
Mutual Fund investments are subject to market risks. Please read the offer document carefully before investing